
July 8, 2024
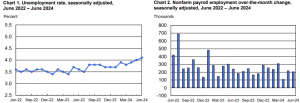
According to the U.S. Bureau of Labor Statistics, total nonfarm payroll employment increased by 206,000 in June, and the unemployment rate changed little at 4.1 percent. Notable, job gains occurred in government, health care, social assistance, and construction. The U.S. Bureau of Labor Statistics reported these findings based on two monthly surveys: the household survey, which assesses labor force status, including unemployment by demographic characteristics, and the establishment survey, which measures nonfarm employment, hours, and earnings by industry.
Household Survey Data
In June, the U.S. labour market saw stable but elevated unemployment figures compared to a year ago. The unemployment rate remained unchanged at 4.1%, with 6.8 million people unemployed, slightly higher than the previous year’s 3.6% rate and 6.0 million unemployed. Unemployment among adult women and Asians increased, while rates for adult men, teenagers, Whites, Blacks, and Hispanics showed minimal change. Long-term unemployment, defined as those jobless for 27 weeks or more, rose to 1.5 million, up from 1.1 million a year ago, constituting 22.2% of all unemployed individuals. The labour force participation rate and employment-population ratio remained steady at 62.6% and 60.1%, respectively, with no significant change over the year.
In June, the number of people employed part-time for economic reasons remained steady at 4.2 million, indicating a preference for full-time work despite reduced hours or inability to find full-time jobs. The count of those not in the labour force but desiring a job decreased by 483,000 to 5.2 million, though they were not classified as unemployed due to inactivity in job seeking or unavailability. Among these individuals, 1.5 million were marginally attached to the labour force, showing no significant change, while the number of discouraged workers, who believe no jobs are available for them, slightly decreased to 365,000.
.
Establishment Survey Data
In June, total nonfarm payroll employment rose by 206,000, close to the 12-month average of 220,000. Significant job gains were seen in government (+70,000), health care (+49,000), social assistance (+34,000), and construction (+27,000). Government employment, particularly in local government excluding education and state government, saw a notable increase. Health care employment grew mainly in ambulatory services and hospitals. Social assistance and construction employment also saw higher-than-average increases. Retail trade employment declined slightly, while professional and business services saw little change, with a decline in temporary help services but a rise in professional, scientific, and technical services. Other major industries, including mining, manufacturing, and leisure and hospitality, showed little change in employment.
In June, average hourly earnings for all employees on private nonfarm payrolls rose by 10 cents, or 0.3%, to $35.00, marking a 3.9% increase over the past year. For private-sector production and nonsupervisory employees, average hourly earnings also increased by 10 cents, or 0.3%, to $30.05. The average workweek for all private nonfarm employees remained steady at 34.3 hours for the third consecutive month, while the manufacturing workweek held at 40.2 hours with 3.0 hours of overtime. The average workweek for production and nonsupervisory employees slightly decreased by 0.1 hour to 33.7 hours.
The total nonfarm payroll employment changes for April and May were revised downward, with April’s figure adjusted from +165,000 to +108,000 (a decrease of 57,000) and May’s figure from +272,000 to +218,000 (a decrease of 54,000). Combined, these revisions indicate that employment for the two months is 111,000 lower than previously reported. These adjustments are due to additional reports from businesses and government agencies and recalculations of seasonal factors.
Disclaimer:
Analyst Certification – The views expressed in this research report accurately reflect the personal views of Mayberry Investments Limited Research Department about those issuer (s) or securities as at the date of this report. Each research analyst (s) also certify that no part of their compensation was, is, or will be, directly or indirectly, related to the specific recommendation(s) or view (s) expressed by that research analyst in this research report.
Company Disclosure – The information contained herein has been obtained from sources believed to be reliable, however its accuracy and completeness cannot be guaranteed. You are hereby notified that any disclosure, copying, distribution or taking any action in reliance on the contents of this information is strictly prohibited and may be unlawful. Mayberry may effect transactions or have positions in securities mentioned herein. In addition, employees of Mayberry may have positions and effect transactions in the securities mentioned herein.


