
February 6, 2024
In January, the U.S. Bureau of Labor Statistics announced a notable increase in total nonfarm payroll employment, rising by 353,000. Despite this growth, the unemployment rate held steady at 3.7 percent. Key sectors experiencing job gains included professional and business services, health care, retail trade, and social assistance. However, there was a decline in employment within the mining, quarrying, and oil and gas extraction industry. The U.S. Bureau of Labor Statistics reported these findings based on two monthly surveys: the household survey, which assesses labor force status, including unemployment by demographic characteristics, and the establishment survey, which measures nonfarm employment, hours, and earnings by industry.
Household Survey Data
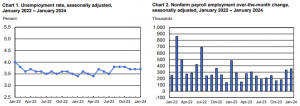
In January, the U.S. unemployment rate remained at 3.7 percent for the third month in a row, with 6.1 million unemployed persons. Among the various demographic groups, the unemployment rate for adult men (3.6 percent), adult women (3.2 percent), teenagers (10.6 percent), Whites (3.4 percent), Blacks (5.3 percent), Asians (2.9 percent), and Hispanics (5.0 percent), showing minimal changes in January. The number of long-term unemployed (27 weeks or more) was slightly change to 1.3 million, accounting for 20.8 percent of all unemployed. The labor force participation rate, at 62.5 percent, was unchanged in January, while the employment-population ratio, at 60.2 percent, was little changed. Part-time employment for economic reasons slightly changed to 4.4 million. The number of individuals not in the labor force but desiring a job rose slightly to 5.8 million. Among them, marginally attached individuals totalled 1.7 million, with discouraged workers growing to 452,000 in January.
Establishment Survey Data
In January, total nonfarm payroll employment in the US increased by 353,000, similar to the gain seen in December. Key sectors driving this growth included professional and business services, health care, retail trade, and social assistance. Professional and business services notably added 74,000 jobs, well above the monthly average in 2023, while health care saw an increase of 70,000 jobs. However, the mining, quarrying, and oil and gas extraction industry experienced a decline in employment by 5,000 jobs. Despite some fluctuations in specific industries, overall employment remained relatively stable in other major sectors.
In January, there was a notable increase in average hourly earnings for all employees on private nonfarm payrolls, rising by 19 cents or 0.6 percent to $34.55. Over the past 12 months, average hourly earnings have grown by 4.5 percent, indicating a significant uptick in wages. Similarly, average hourly earnings for private-sector production and nonsupervisory employees also saw an increase, rising by 13 cents or 0.4 percent to $29.66. However, the average workweek for all employees on private nonfarm payrolls slightly decreased by 0.2 hours to 34.1 hours, with a year-over-year decline of 0.5 hours. Despite this, the manufacturing sector maintained stability with an unchanged average workweek at 39.8 hours.
The U.S. Bureau of Labor Statistics reported revisions to total nonfarm payroll employment figures for November and December, resulting in significant adjustments. November’s employment change was revised up by 9,000, from +173,000 to +182,000, while December’s change was revised up by a substantial 117,000, from +216,000 to +333,000. These revisions indicate stronger job growth than previously reported, with a combined increase of 126,000 jobs for the two months. The revisions are attributed to additional reports received from businesses and government agencies, as well as recalculations of seasonal factors. The annual benchmark process also played a role in these revisions. Overall, the adjustments reflect a more robust employment trend than initially indicated.
Disclaimer:
Analyst Certification – The views expressed in this research report accurately reflect the personal views of Mayberry Investments Limited Research Department about those issuer (s) or securities as at the date of this report. Each research analyst (s) also certify that no part of their compensation was, is, or will be, directly or indirectly, related to the specific recommendation(s) or view (s) expressed by that research analyst in this research report.
Company Disclosure – The information contained herein has been obtained from sources believed to be reliable, however its accuracy and completeness cannot be guaranteed. You are hereby notified that any disclosure, copying, distribution or taking any action in reliance on the contents of this information is strictly prohibited and may be unlawful. Mayberry may effect transactions or have positions in securities mentioned herein. In addition, employees of Mayberry may have positions and effect transactions in the securities mentioned herein.


