
January 12, 2023
United States Inflation Rate increased 6.5% year over year in December 2022, in line with analyst estimates (6.5%)
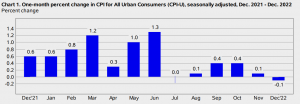
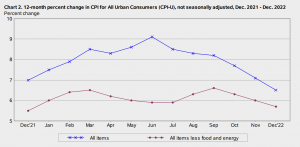
According to a study released today by the U.S. Bureau of Labor Statistics, the Consumer Price Index for All Urban Consumers (CPI-U) decreased 0.1 percent on a seasonally adjusted basis in December after rising 0.1 percent in November. Before seasonal adjustment, the all items index rose 6.5 percent over the previous 12 months.
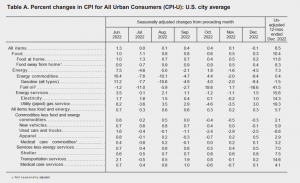
Gasoline was by far the biggest factor in the monthly decline in all categories, more than offsetting rises in the indexes for shelter. The food index climbed by 0.3% during the course of the month, while the index for food consumed at home increased by 0.2%. Other significant energy component indices climbed throughout the course of the month, while the energy index fell by 4.5 percent as the gasoline index fell.
After increasing 0.2 percent in November, the index for all products excluding food and energy increased by 0.3 percent in December. The housing, household goods and services, automobile insurance, leisure, and clothing indices all saw increases in December. Among the indexes that fell over the course of the month were those for used vehicles and trucks and airline tickets.
The increase in the all-items index for the 12 months ending in December was only 6.5 percent, which was the smallest 12-month increase since the 12 months ended in October 2021. Over the past 12 months, the index for all items minus food and energy increased by 5.7%. The food index grew 10.4% percent over the past year, while the energy index increased 7.3%; all of these increases were lower than for the 12-month period ending November.
Food
Following a 0.5 percent gain in November, the food index increased by 0.3 percent in December. In December, the food at home index increased 0.2%. Three of the six main food group indexes from grocery stores have risen this month. In December, the index for fish, poultry, meats, and eggs gained 1.0 percent, while the index for eggs increased 11.1 percent. While the index for non-alcoholic beverages increased 0.1 percent in December, the index for other meals consumed at home increased by 0.4 percent over the month.
The fresh fruit index, on the other hand, had a monthly decline of 1.9 percent, while the fruits and vegetables index dropped by 0.6 percent. While the index for cereals and bakery goods remained steady in December, the index for dairy and associated items fell by 0.3%.
After growing by 0.5 percent in November, the food away from home index increased by 0.4 percent in December. Over the course of the month, the index for meals with limited service rose by 0.5 percent, and the index for meals with full service rose by 0.1 percent.
Over the previous 12 months, the index of food at home increased by 11.8 percent. The index for breakfast cereals and bread goods increased 16.1% in one year. Meats, poultry, fish, and eggs had rises of 7.7%, while dairy and allied goods saw increases of 15.3%. These were the remaining major grocery store food groups.
Energy
The energy index dropped 1.6 percent in November before dropping 4.5 percent in December. Following a 2.0-percent drop in November, the gasoline index fell 9.4 percent over the course of the month. (Prices of gasoline decreased 12.5% in December prior to seasonal adjustment.) After falling by 3.5 percent in November, the natural gas index increased by 3.0 percent during the course of the month. In December, the electricity index rose by 1.0 percent.
Over the previous 12 months, the energy index increased 7.3%. Over the period, the gasoline index fell by 1.5 percent. Over the previous 12 months, the index for fuel oil increased by 41.5 percent, the index for electricity by 14.3 percent, and the index for natural gas by 19.3 percent.
All items less food and energy
In December, after increasing by 0.2 percent in November, the index for all products except food and energy increased by 0.3 percent. The shelter index increased again this month, reaching 0.8 percent overall. Both the owners’ equivalent rent index and the rent index increased by 0.8 percent during the course of the month. Following a decrease of 0.7% in November, the index for lodging away from home jumped by 1.5% in December.
The monthly increase in the index for all products except food and energy was mostly driven by the shelter index, while the other components varied between gains and losses. The index for household operations and furnishings rose by 0.3 percent during the month, while the index for motor vehicle insurance jumped by 0.6 percent and the index for entertainment increased by 0.2 percent. In December, both the apparel and education indices improved by 0.5 and 0.3 percent, respectively.
After decreasing for the previous two months, the medical care index increased by 0.1 percent in December. Over the course of the month, the hospital services index went up 1.7%. Both the index for prescription medications and medical services increased by 0.1 percent in December.
The used automobile and truck index was one of the indices that fell over the course of the month, down 2.5 percent in December for the sixth month in a row. Following a 3.0% drop in November, the airline fare index dropped 3.1% during the course of the month. Both the new vehicle index and the personal care index saw a decrease in December of 0.1 percent.
Over the previous 12 months, the index for all products minus food and energy increased by 5.7%. Over the past year, the index for shelter grew by 7.5%, making up more than half of the overall increase in all categories except food and energy. Other indexes that have seen significant growth in the past year include home operations and furnishings (up 6.7%), health care (up 4.0%), new cars (up 5.9%), and leisure (up 5.1%).
Disclaimer:
Analyst Certification -The views expressed in this research report accurately reflect the personal views of Mayberry Investments Limited Research Department about those issuer (s) or securities as at the date of this report. Each research analyst (s) also certify that no part of their compensation was, is, or will be, directly or indirectly, related to the specific recommendation(s) or view (s) expressed by that research analyst in this research report.
Company Disclosure -The information contained herein has been obtained from sources believed to be reliable, however its accuracy and completeness cannot be guaranteed. You are hereby notified that any disclosure, copying, distribution or taking any action in reliance on the contents of this information is strictly prohibited and may be unlawful. Mayberry may affect transactions or have positions in securities mentioned herein. In addition, employees of Mayberry may have positions and effect transactions in the securities mentioned herein.


