
March 10, 2023
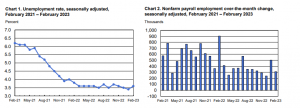
US Unemployment rate increase to 3.6% in February 2023 from 3.4% in January 2023
According to today’s report from the U.S. Bureau of Labor Statistics, total nonfarm payroll employment increased by 311,000 in February while the unemployment rate crept up to 3.6%. The retail industry, government, health care, leisure, and hospitality all had significant job growth. Information, transportation, and warehousing all saw a reduction in employment.
Household Survey Data
In February, the jobless rate increased to 3.6% and there were 5.9 million unemployed people. Since early 2022, there hasn’t been much net movement in these metrics. The unemployment rate for Hispanics (5.3%) increased in February among the main worker categories. Adult men (3.3%), adult women (3.2%), teens (11.1%), Whites (3.2%), Blacks (5.7%), and Asians (3.4%) all had very stable unemployment rates over the course of the month. The number of people who lost their jobs and finished temporary positions rose by 223,000 in February to reach 2.8 million.
The number of those unemployed for fewer than five weeks grew by 343,000 to 2.3 million, counteracting a decline in the previous month. The number of long-term unemployed, or those without a job for 27 weeks or more, remained relatively stable in February at 1.1 million, making up 17.6% of all unemployed people.
The employment-population ratio remained at 60.2%, and the labor force participation rate barely moved at 62.5%. These measurements haven’t changed much overall since the beginning of 2022 and are still below their pre-pandemic levels of February 2020 (63.3% and 61.1%, respectively).
At 4.1 million, the number of people working part-time for economic reasons remained largely constant in February. Due to their reduced hours or inability to acquire full-time employment, these people, who preferred full-time employment, were working part-time jobs.
At 5.1 million in February, the number of people who are currently looking for work but are not in the labor force has not changed much. Due to their inactivity or inability to accept a job offer during the four weeks before to the poll, these people were not counted as unemployed.
The number of people marginally affiliated to the labor force—those not in the labor force but seeking employment—remained essentially unchanged in February at 1.4 million. These people wanted and were open to working, and they had looked for a job at some point in the previous year, but not in the four weeks before the poll. At 363,000, the number of discouraged workers—a subset of the marginally attached—who thought there were no jobs available for them changed slightly over the course of the month.
Establishment Survey Data
Comparing February’s growth in total nonfarm payroll employment to the average monthly gain of 343,000 for the preceding six months, the latter was 311,000. The retail industry, government, health care, leisure and hospitality, and government all had significant job growth in February. Information, transportation, and warehousing all saw a reduction in employment.
In February, the leisure and hospitality sector gained 105,000 jobs, matching the sector’s average monthly growth of 91,000 for the preceding six months. In February, employment increased by 70,000 in the food and beverage industry and by 14,000 in the lodging industry. 410,000, or 2.4%, fewer people are employed in leisure and hospitality than there were in February 2020 before the pandemic.
The increase in retail employment in February was 50,000 and was driven by an increase in general merchandise shops (+39,000). On the whole, employment in the retail sector has not changed much in the past year.
February had a 46,000 increase in government employment, roughly in line with the 6 month average monthly increase of 44,000. In February (+37,000), local government employment remained on the rise. In total, government employment is 376,000, or 1.6%, below its pre-pandemic February 2020 level.
Management, scientific, and technical consulting services saw an increase of 12,000 employees in February, continuing the upward trend of professional and business service employment (+45,000). Over the previous six months, employment in professional and commercial services had grown by an average of 35,000 each month.
In February, the health care sector gained 44,000 jobs, down from an average monthly rise of 54,000 over the previous six months. Hospitals added 19,000 jobs in February, and nursing homes and residential care facilities added 14,000 jobs.
Employment in the construction industry increased by 24,000 in February, maintaining the 20,000 average monthly gain over the previous six months.
Social assistance employment increased by 19,000 in February, which was in line with the 22,000 average monthly increase over the previous six months.
The IT sector lost 25,000 jobs in February. Employment declined by 9,000 in the film and sound recording sectors and by 9,000 in telecommunications (-3,000). Since November 2022, there has been a 54,000% decline in information employment.
Including 9,000 employment in truck transportation, the transportation and warehousing industries lost 22,000 jobs in February. Since October 2022, fewer 42,000 people are employed in transportation and warehousing.
Other significant industries, such as manufacturing, wholesale commerce, financial services, mining, quarrying, and oil and gas extraction, as well as other services, experienced no change in employment during the course of the month.
The average hourly wage for all workers on private nonfarm payrolls increased by 8 cents, or 0.2%, to $33.09 in February. Average hourly wages have climbed by 4.6% during the previous 12 months. Private sector production and nonsupervisory workers’ average hourly pay increased by 13 cents, or 0.5%, to $28.42 in February.
All employees on private nonfarm payrolls had a slight decrease in their average workweek in February, falling by 0.1 hour to 34.5 hours. The average workweek in manufacturing decreased by 0.2 hours to 40.3 hours, and overtime decreased by 0.1 hours to 3.0 hours. Production and nonsupervisory employees on private nonfarm payrolls saw a 0.2-hour drop in their typical workweek to 33.9 hours.
Disclaimer:
Analyst Certification -The views expressed in this research report accurately reflect the personal views of Mayberry Investments Limited Research Department about those issuer (s) or securities as at the date of this report. Each research analyst (s) also certify that no part of their compensation was, is, or will be, directly or indirectly, related to the specific recommendation(s) or view (s) expressed by that research analyst in this research report.
Company Disclosure -The information contained herein has been obtained from sources believed to be reliable, however its accuracy and completeness cannot be guaranteed. You are hereby notified that any disclosure, copying, distribution or taking any action in reliance on the contents of this information is strictly prohibited and may be unlawful. Mayberry may affect transactions or have positions in securities mentioned herein. In addition, employees of Mayberry may have positions and effect transactions in the securities mentioned herein.


