
Date: March 11, 2019
Interest income fell by 0.6% to $731.26 million relative to 2017’s $735.67 million. Interest income for the quarter amounted to $208.02 million, 17% above the $117.77 million booked for the similar quarter of 2017. Additionally, other interest income for the year was realized at $7.10 million (2017: nil). Management noted, “this growth in revenue was attributable to a 65% growth in net fees and commissions to $826.7 million consistent with your Company’s strategic objectives of growing our Capital Markets and Asset Management Units. Our Capital Markets Unit arranged transactions valued at over $19.3 billion in line with our commitment to provide creative finance solutions to grow business.”
Interest expense for the year decreased by 6.7% to $455.81 million (2017: 488.68 million). As a result, net interest income increased by 14% to $282.55 million compared to $246.99 million in 2017. Net interest income for the quarter amounted to $100.28 million (2017: $55.47 million).
Gain from investment activities totalled $182.8 million for the twelve months relative to the previous year’s income of $193.08 million.
Other income decreased of 44% to close at $14.74 million relative to 2017’s $26.23 million.
Net fees and commissions increased by 65% to $826.68 million (2017: $500.16 million), resulting in an operating revenue of $1.02 billion. This compares to an operating profit of $719.47 million booked twelve months earlier. As a result, net interest income and other operating income increased by 35% to $1.31 billion compared to $966.46 million in 2017.
Staff costs amounted to $349.07 million in contrast to $292.33 recorded in 2017. Total other operating expenses for the year amounted to $313.23 million compared to $206.30 million booked in the previous year. Management indicated, “Operating expenses, excluding the provision for credit losses on financial assets, totalled $662.3 million, representing an increase of 33% when compared to the prior year, due mainly to our investment in human resources as well as the implementation of our new Investment Management System (OPICS), which will allow us to seamlessly and efficiently launch various other assets management products. Our efficiency ratio ended the year at 50.7% from 51.6% for the corresponding prior year period.”
Consequently, profit before taxation amounted to $539.04 million relative to a profit of $467.83 million in 2017.
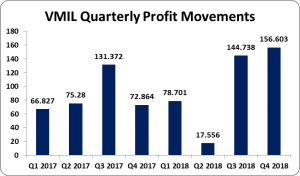
Tax charges for the year amounted to $141.44 million, a 16% increase when compared with $121.52 incurred by VMIL for 2017. As a result, the net profit for the year amounted to $397.60 million relative to a profit of $346.30 million. Net profit for the quarter amounted to $156.60 million compared to a $72.86 million for 2017. VMIL noted, “as previously reported in our Second and Third Quarter releases, net income was negatively impacted by a $105.5 million provision for expected credit losses in respect of Government of Barbados global bonds (GoB bonds) held by our wholly-owned subsidiary, Victoria Mutual Wealth Management Limited. If it had not been for the credit loss provision on the GoB bonds, net profit for 2018 would have been $503 million, being 45% over the comparative 2017 period.”
Earnings per share (EPS) amounted to $0.27 for the period, relative to earnings per share of $0.23 in 2017. EPS for the quarter amounted to $0.10 versus a EPS of $0.05 for the corresponding quarter of 2017. The number of shares used in our calculations is 1,500,025. Notably, VMIL stock price close the trading period on March 08, 2019 at $3.75.
Balance Sheet Highlights:
The company, as at December 31, 2018, recorded total assets of $21.61 million, an increase of 8% when compared to $20.07 million recorded last year. The increase was mainly attributed to Loan Receivables which closed at $1.38 million relative to $441.06 million in 2017. Investment securities also contributed to the increase to close at $13.24 billion compared to $11.68 billion as at December 21, 2017.
Total Stockholders’ Equity as at December 31, 2018, closed at $2.72 million (2017: $2.53 million), resulting in a book value per share of $1.81 per share compared to $1.69.
Analyst Certification -The views expressed in this research report accurately reflect the personal views of Mayberry Investments Limited Research Department about those issuer (s) or securities as at the date of this report. Each research analyst (s) also certify that no part of their compensation was, is, or will be, directly or indirectly, related to the specific recommendation (s) or view (s) expressed by that research analyst in this research report.
Company Disclosure -The information contained herein has been obtained from sources believed to be reliable, however its accuracy and completeness cannot be guaranteed. You are hereby notified that any disclosure, copying, distribution or taking any action in reliance on the contents of this information is strictly prohibited and may be unlawful. Mayberry may effect transactions or have positions in securities mentioned herein. In addition, employees of Mayberry may have positions and effect transactions in the securities mentioned herein.


