July 30, 2020
Victoria Mutual Investments Limited (VMIL), for the six months ended June 30, 2020, reported total interest income of $461.86 million, an increase of 16% relative to the $398.40 million recorded for the corresponding period in 2019. Interest income for the quarter amounted to $219.99 million, up 11% on the $197.41 million reported for the corresponding period in 2019.
Interest expense for the period amounted to $322.30 million, a 25% increase relative to the $258.05 million recorded in 2019. As such, Net interest income closed the period at $139.56 million, a 1% down from $140.35 million recorded for the corresponding period in 2019. Net interest income for the quarter amounted to $59.71 million versus $65.17 million booked for the second quarter of 2019.
VMIL recorded gains from investment activities for the period of $120.21 million, a 28% decrease relative to the gain of $167.28 million recorded in 2019.
Net fees and commissions closed the period at $474.17 million, a decrease of 3% compared with the $489.51 million recorded for the comparable period in 2019.
Other expenses for the six months reflected a total of $15.78 million, relative to an income of $29.80 million recorded for last year.
VMIL noted, “This performance was predominantly driven by the following:
- Our Capital Markets Unit had a strong second quarter performance with fee income of $174.55 million, representing an increase of $98.75 million when compared with the first quarter.
- Gains from Investment activities has made a turnaround in the second quarter, reporting a gain of $3.71 million when compared to a loss of $100.84 million in the first quarter.
- Continued strong performance of our Asset Management Unit, with our Classic Income and Property Portfolios generating market leading returns. Our Asset Management Unit will, in the future, benefit from the expanded distribution channels.
- Our Bond Trading Desk continued its steady earnings, contributing revenues of $118.77 million for the June 2020 quarter.
- Our HR Engagement Index, a key strategic metric, showed a 7% improvement to 79% year over year, as efforts continue towards executing on our Employee Value Proposition. Key Drivers showing an improvement were Culture, Opportunity, Rewards and Recognition, Work Life and Leadership.
- In keeping with our commitment to empower our clients with knowledge for their financial well-being, this quarter we executed on various educational initiatives, including our flagship VM Wealth Talks series. Three webinars were executed themed ‘Stock Markets Exposed’, ‘Coping Strategies for Children’ and ‘Business and Investment Strategies for a Pandemic Era’.”
- Other operating income for the period decreased 13% to $578.60 million relative to $686.59 million booked for the same period in 2019. Net interest income and other operating revenue closed at $718.16 million versus $826.94 million for the six month ended June 30, 2019. Net interest income and other operating revenue for the quarter totaled $449.78 million, 13% above the $397.58 million reported for the same period in 2019.
Staff cost and other operating expenses increased 20% and 17% respectively, to close the period at $294.71 million (2019: $245.26 million) and $281.59 million (2019: $240.72 million) respectively. Management noted, “The increase in expenses was primarily attributable to an increase in costs related to people development of $49.45 million or 20.16%. Other expenses related to impairment losses on financial assets, asset tax and support services required to grow our business.” Provision for credit losses on financial assets rose 114% year over year to close at $35.26 million (2019: $16.44 million).
Operating Profit closed the period under review at $106.60 million (2019: $324.51 million), while the quarter operating profit amounted to $186.04 (2019: $163.84 million). Additionally, Share of loss in associate amounted to $16.16 million and $7.04 million for year to date and the second quarter, respectively.
Profit before taxation amounted to $90.43 million for the period, a 72% decrease relative to $324.51 million recorded for the prior financial year. Taxation credited amounted to $80.46 million versus taxation charge of $71.73 million booked in 2019.
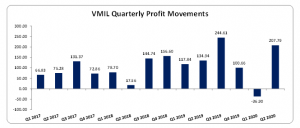
Consequently, net profit for the six months totaled $170.89 million, a 32% or $81.89 million decrease relative to the $252.78 million booked for the same period of 2019. VMIL net profit for the quarter closed at $207.79 million compared to $134.94 million booked in 2019.
Total comprehensive loss for the period amounted to $74.19 million, relative to an income of 1.36 billion booked in 2019. As for the quarter, total comprehensive income amounted to $910.37 million, 17% increase when compared to income of $780.34 million recorded for the same quarter last year
Earnings per share totalled $0.11 (2019: $0.17) for the period under review. EPS for the quarter amounted to $0.14 (2019: $0.09) The twelve-month trailing earnings per share is $0.34. The number of shares used in our calculations 1,500,025,000 units. Notably, VMILs stock price closed the trading period on July 29, 2020 at a price of $6.88.
Balance Sheet at a glance:
As at June 30, 2020, The Company’s asset base totaled $23.55 billion, 5% down from $24.66 billion as at June 30, 2019. The main contributor to the decrease in total assets was ‘Investment Securities’ which amounted to $15.05 billion relative to $17.24 billion for the prior year.
Total Stockholders’ Equity as at June 30, 2020 was $4.21 billion (2019: $4.09 billion); resulting in a book value per share of $2.81 (2019: $2.73).
Analyst Certification -The views expressed in this research report accurately reflect the personal views of Mayberry Investments Limited Research Department about those issuer (s) or securities as at the date of this report. Each research analyst (s) also certify that no part of their compensation was, is, or will be, directly or indirectly, related to the specific recommendation (s) or view (s) expressed by that research analyst in this research report.
Company Disclosure -The information contained herein has been obtained from sources believed to be reliable, however its accuracy and completeness cannot be guaranteed. You are hereby notified that any disclosure, copying, distribution or taking any action in reliance on the contents of this information is strictly prohibited and may be unlawful. Mayberry may effect transactions or have positions in securities mentioned herein. In addition, employees of Mayberry may have positions and effect transactions in the securities mentioned here


