
March 02,2018
Victoria Mutual Investments (VMIL) for the year ended December 31, 2017 reported total interest income of $735.67 million, a marginal increase of 0.4% relative to the $732.75 million recorded for the corresponding period in 2016.
Interest expense for the period amounted to $488.68 million, relative to the $481.99 million recorded in 2016.
As such, Net interest income closed the period at $246.99 million, a 1.5% or $3.77 million decline relative to the $250.76 million recorded for the corresponding period in 2016.
VMIL recorded gains from investment activities for the period of $193.08 million, a 30.7% or $85.55 million decline relative to the gain of $278.62 recorded in 2016.
Net fees and commissions closed the period at $500.16 million, a gross increase of $78.9% compared with the 279.58 million recorded for the comparable period in 2016.
Other income for the year reflected a total of $26.23 million, a significant increase of $24.38 million or 1321.5% surge compared to $1.85 million recorded for last year.
Staff cost and other operating expenses increased 35.2% and 2.8% respectively, to close the period at $292.33 million (2016: $216.29 million) and $206.30 million (2016: $200.78 million) respectively. The company noted, “We invested in human resources to meet the changing needs of our business”.
Profit before taxation amounted to $467.83 million for the period, an 18.8% or $45.07 increase relative to $393.73 million recorded for the prior financial year. Taxation amounted to $121.52 million (2016: $76.46 million).
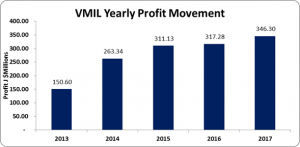
Consequently, net profit for the year totaled $346.30 million, a 9.1% or $29.02 million increase relative to the $317.28 million booked for the same period on 2016.
Earnings per share totalled $0.23 (2016: $0.21) for the year. The number of shares used in our calculations 1,500,025,000 units. Notably, VMILs stock price closed the trading period on March 1, 2018 at a price of $4.42.
Management noted, “Our Unit Trust portfolios exhibited impressive growth, with our Bond Fund II and III portfolios being the top performing US Dollar Funds for 2017, providing returns of 6.3% and 7.3%, respectively. In addition, our Equity Unit Trust Portfolio delivered excellent returns of 30.1% and our -More- Property Fund, which invests in high quality commercial real estate, had an encouraging start with new acquisitions planned for 2018.”
Balance Sheet:
As at December 31, 2017, The Company’s asset base totaled $20.07 billion, up from $16.26 billion at December 31, 2016. The main contributor to the increase in total assets was ‘Cash and Cash Equivalents’ and ‘Resale Agreements’ which contributed $3.41 billion and $3.37 billion respectively relative to $316.98 million and $1.98 billion for the 2016 year end. VMIL noted, “This was primarily attributable to funds received from or on behalf of clients”.
Total Stockholders’ Equity as at December 31, 2017 was $2.58 billion (2016: $1.61 billion); resulting in a book value per share of $1.72 (2016: $1.08).
Disclaimer:
Analyst Certification -This research report is for information purposes only and should not be construed as a recommendation. Each research analyst (s) also certify that no part of their compensation was, is, or will be, directly or indirectly, related to the specific recommendation (s) or view (s) expressed by that research analyst in this research report.
Company Disclosure -The information contained herein has been obtained from sources believed to be reliable, however its accuracy and completeness cannot be guaranteed. You are hereby notified that any disclosure, copying, distribution or taking any action in reliance on the contents of this information is strictly prohibited and may be unlawful. Mayberry may effect transactions or have positions in securities mentioned herein. In addition, employees of Mayberry may have positions and effect transactions in the securities mentioned herein.


