May 16, 2022
In Q1 of FY22, Victoria Mutual Investments (VMIL) reported Total Interest Income of $334.57 million, a 30% increase relative to the $256.68 million recorded for the corresponding period in 2021. Interest Expense for the three months amounted to $254.80 million, a 44% increase relative to the $176.53 million recorded in 2021.
VMIL earned Net Interest Income of $79.77 million vs $80.15 million reported twelve months earlier.
‘Other Operating Revenue’ comprising of gains from investment activities, dividend income, gains from margin loans, fees & commission fell by 25% to $303.43 million (2021: $ 402.30 million).
Gains from Investment Activities closed at $72.66 million, 64% lower when compared against Q1 of 2021 when the firm reporting gains of $ 199.39 million.
Net Fees and Commissions grew by 34% to $216.42 million (2021: $161.41 million).
‘Other Income’ reported was $14.34 million (Q1 2021: $41.50 million) while VMIL reported no earnings from dividend income or margin loans in Q1 of FY22.
Staff Costs and other operating expenses increased 4% and 13% respectively. Closing Q1 at $168.46 million (2021: $162.36 million) and $214.89 million (2021: $189.82 million).
Given the disproportionate growth in expenses to income, VMIL reported an Operating Loss of $12.08 million for the three months ended March 31, 2022, relative to a profit of $107.85 million recorded in Q1 FY2021.
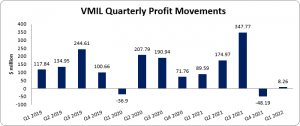
The investment firm received a tax credit of $29.16 million (2021: Tax charge of $9.69 million). Because of that credit, VMIL was able to post a Net Profit of $8.26 million. This is 91% lower than the $89.59 million recorded in Q1 of 2021.
Owing to negative changes in the fair value of their Investment Securities, VMIL reported a Total Comprehensive Loss for the three months ended March 31, 2022 of $348.69 million relative to a loss of $270.53 million in 2021.
Given the firm’s current earnings, VMIL outputs an Earnings per Share of $0.01 (2021: $0.06). On a twelve-month trailing basis, VMIL outputs an EPS is $0.32. The number of shares used in our calculations was 1,500,025,000 units. Notably, VMIL’s stock price closed the trading period on May 13, 2022 at $6.00 with a corresponding P/E of 18.64 times.
Balance Sheet at a Glance:
As at March 31, 2022, The firm’s Total Assets was worth $30.22 billion (Q1 2021: $27.53 billion). The main contributors to the increase in total assets was a $2.67 billion increases in ‘Loans Receivable’ which amounted to $4.37 billion relative to $1.70 billion in 2021. ‘Investment Securities’ also contributed to the growth in total assets, closing at $20.55 billion (2021: $19.01 billion).
Total Stockholders’ Equity at the end of Q1 FY 2022 was $3.70 billion (2021: $4.11 billion); resulting in a book value per share of $2.47 (2021: $2.74). However, Retained Earnings in the quarter grew to $2.78 billion (2021: $2.53 billion).
Disclaimer:
Analyst Certification -The views expressed in this research report accurately reflect the personal views of Mayberry Investments Limited Research Department about those issuer (s) or securities as at the date of this report. Each research analyst (s) also certify that no part of their compensation was, is, or will be, directly or indirectly, related to the specific recommendation(s) or view (s) expressed by that research analyst in this research report.
Company Disclosure -The information contained herein has been obtained from sources believed to be reliable, however its accuracy and completeness cannot be guaranteed. You are hereby notified that any disclosure, copying, distribution or taking any action in reliance on the contents of this information is strictly prohibited and may be unlawful. Mayberry may effect transactions or have positions in securities mentioned herein. In addition, employees of Mayberry may have positions and effect transactions in the securities mentioned herein.

