November 15, 2022
Sagicor Real Estate XFUND Limited (XFUND)
For the nine months ended September 30, 2022
Sagicor Real Estate XFUND Limited (XFUND), for the nine months ended September 30, 2022, reported total revenue of $5.17 billion relative to $3.91 billion reported in 2021, a 32% increase year over year. Revenue for the quarter increased 44% to $1.75 billion (2021: $1.22 billion) XFUND noted ” The solid performance continues to be driven by its hotel operations, buoyed by an increase in bookings and occupancy levels.”
Net Investment income increased 175% year over year to $211.43 million from $76.89 million in 2021. Hotel revenue for the nine-month period increased to $5.19 billion compared to the $3.03 billion reported in 2021.
Operating expenses rose by 37% to $4.81 billion (2021: $3.51 billion). Of this:
- Hotel expenses increased to $3.78 billion, up by 59% versus the $2.38 billion in the year prior.
- Depreciation expense assigned for the period $655.73 million (2021: $596.94 million) for the period under review. Interest expense for the period declined 42% to $271.25 million (2021: $469.66 million).
- Other operating expenses increased to $104.56 million (2021: $59.33 million).
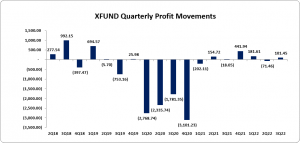
XFUND reported profit before tax of $365.44 million relative to $173.76 million for the nine months period. After paying taxes of $153.83 million, XFUND reported a net profit of $211.60 million compared to a net profit of $278.93 million in 2021. Net profit for the quarter closed at $101.45 million versus 2021 net loss of $18.05 million.
Net profit attributable to shareholders for the period under review totalled $211.6 million compared to net loss attributable of $65.43 million booked twelve months prior. Net Profit attributable to shareholders for the quarter amounted to $101.45 million compared to net loss attributable to shareholders of $18.05 million reported in 2021.
XFUND closed their nine months with an EPS of $0.09. In 2021, XFUND reported a loss per share (LPS) of $0.03. For the quarter, EPS amounted to $0.05 versus LPS of $0.01. The trailing twelve-month EPS is $0.29 and the number of shares used in our calculations was 2,243,005,125. As at November 15, 2022, the stock traded at $8.24 with a P/E of 28.28 times.
Balance Sheet Highlights:
The Company, as at September 30 , 2022, recorded total assets of $28.37 billion, a 8% decrease when compared to $30.96 billion reported in 2021. The decrease was primarily due to the liquidation of “Financial Investments” which closed the period at $0 (2021: $5.77 billion).
Total Shareholders’ Equity as at September 30, 2022 closed at $18.71 billion, a 20% increase from the $15.56 billion reported for the corresponding period last year; resulting in a book value per share of approximately $8.34 (2021: $6.94).
Disclaimer:
Analyst Certification -The views expressed in this research report accurately reflect the personal views of Mayberry Investments Limited Research Department about those issuer (s) or securities as at the date of this report. Each research analyst (s) also certify that no part of their compensation was, is, or will be, directly or indirectly, related to the specific recommendation(s) or view (s) expressed by that research analyst in this research report.
Company Disclosure -The information contained herein has been obtained from sources believed to be reliable, however its accuracy and completeness cannot be guaranteed. You are hereby notified that any disclosure, copying, distribution or taking any action in reliance on the contents of this information is strictly prohibited and may be unlawful. Mayberry may affect transactions or have positions in securities mentioned herein. In addition, employees of Mayberry may have positions and effect transactions in the securities mentioned herein.