
Revenue increased by 12% to total $380.54 million compared to $338.7 million for the same period in 2016. Sales from the Lumber division climbed to $271.69 million, 13% higher than $240.64 million, while sale in the Soap division increased by 11% to close the period at $108.85 million relative to $98.06 million in 2016.
The company outlined that, “export sales continued to outpace increases in sales in the domestic market with an improvement of 27% over the same quarter in the previous year. Although small, particularly noteworthy was the increase in hotel size soaps of 87%.” In addition the company indicated that, “We are working closely with one of our partners to produce two brands of laundry soaps, a project which we hope will commence in October. These brands are not presently sold in the local market but have good sales in the export market. We have the capacity to efficiently produce the product and hope that the negotiations will be successfully completed in September.”
Cost of sales for the period showed an increase of 14%, moving from $256.32 million to $292.45 million. Despite this increase, gross profit amounted to $88.09 million, an increase of 7% when compared to $82.37 million recorded last year.
Administrative expenses saw a decline of 3%, to total $47.41 million (2016: $48.94 million). As such profit from operations totaled $41.82 million, a 5% increase when compared to 2016’s $39.79 million.
Other income, for the period totaled $1.14 million a significant decline when compared to the $6.35 million recorded for the same period last year.
Finance costs of $1.15 million was recorded for the period, an increase of 12% when compared to $1.03 million in the year prior. While finance income totaled $3.11 million relative to $3.85 million in the corresponding period in 2016, a 19% decline.
Profit before tax totaled $43.78 million compared to $42.61 million last year. The company booked tax charges for the period of $5.3 million (2016: $5.2 million).
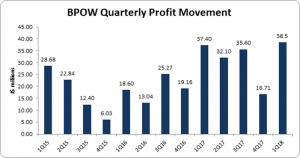
Net Profit for the period totaled $38.48 million, a 3% increase compared to $37.4 million the prior financial year.
Earnings per share for the period totaled $0.68 (2016: $0.66). The twelve-month trailing EPS is $2.18. The number of share used in our calculations amounted to 56,499,000 units.
Balance Sheet at a glance:
As at July 31, 2017, total assets amounted to $813.3 million, up $130.0 million from the balance of $683.32 million as at July 2016. The increase in total assets was as a result of the increase in cash and cash equivalents from $293.56 million, to $336.8 million.
Shareholders’ Equity of $709.71 million was reported (2016: $596.42 million) which resulted in a book value per share of $12.56 (2016: $10.56).
Disclaimer:
Analyst Certification -The views expressed in this research report accurately reflect the personal views of Mayberry Investments Limited Research Department about those issuer (s) or securities as at the date of this report. Each research analyst (s) also certify that no part of their compensation was, is, or will be, directly or indirectly, related to the specific recommendation (s) or view (s) expressed by that research analyst in this research report.
Company Disclosure -The information contained herein has been obtained from sources believed to be reliable, however its accuracy and completeness cannot be guaranteed. You are hereby notified that any disclosure, copying, distribution or taking any action in reliance on the contents of this information is strictly prohibited and may be unlawful. Mayberry may effect transactions or have positions in securities mentioned herein. In addition, employees of Mayberry may have positions and effect transactions in the securities mentioned herein.


