Grace Kennedy Limited (GK)
For the Nine Months ended September 30, 2017:
Revenue totalled $69.30 billion for period (2016: $66.65 billion), a year over year increase of 4%. For the quarter the company increased revenue by 1.75% to total $22.93 billion (2016: $22.53 billion). The biggest contributor to the group’s overall revenue for the nine months was income from the ‘Food Trading’ segment which contributed a total of $54.34 billion (2016: $52.21 billion), an increase of 4% relative to the prior year’s corresponding period. Management noted, “revenue was primarily driven by higher sales from our Jamaican foods business”.
Among the other segments contributing to revenue, ‘Banking & Investments’ increased 8% to total $4.53 billion. GK indicated, “the Banking and Investments segment achieved growth in both revenue and pre-tax profit over prior year. First Global Bank (FGB) reported stronger growth in net interest income and higher gains on securities sold when compared to the same period in 2016. Lower provisions against loan losses also contributed to the favourable performance as the bank continues to focus on delinquency management. During the quarter FGB also launched its “First Global Money Link”, providing convenient and inclusive banking solutions to our customers.”
Revenue from ‘Insurance’ amounted to $4.38 billion, a decrease of 3%, while ‘Money Services’ brought in $6.04 billion, 5% more than the $5.75 billion reported in September 2016. Management indicated, “The company’s performance in the third quarter was affected by hurricanes in September. We are currently assessing the potential impact of claims relating to these hurricanes. GK General Insurance continues to maintain a robust reinsurance programme with highly rated international reinsurers which will lessen the impact of these claims.”
Total Expenses amounted to $66.26 billion relative to $63.75 billion booked for the comparable period in 2016, a 4% growth. Other Income declined 13% to total $1.69 billion (2016: $1.95 billion). As such, ‘Profit from Operations’ amounted to $4.73 billion, a 3% decline year over year from $4.86 billion booked in September 2016.
Interest income from non-financial services rose 3% to total $287.65 million compared to $280.21 million reported a year earlier. Interest expenses from non-financial services amounted to $500.17 million versus $510.52 million booked for the corresponding period in 2016, a 2% reduction.
Share of results of associated companies increased by 12% amounting to $417.70 million, compared to $373.76 million reported for September 2016.
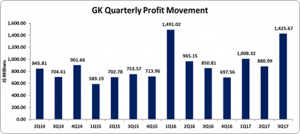
Pre-tax profits decreased 1% to approximately $4.94 billion, compared to pre-tax profit of $5.00 billion documented for the first nine months of 2016. GK incurred taxation expenses amounting to approximately $1.18 billion compared to $1.30 billion in September 2016. Consequently, net profit increased by 1% to $3.75 billion from $3.70 billion booked for the first nine months of 2016. Net profit for the quarter increased 57% to total $1.57 billion relative to $998.25 million reported in 2016.
Net Profits attributable to shareholders amounted to $3.314 billion compared to $3.306 billion a year earlier, reflecting a 0.24% increase. Earnings per share (EPS) for first nine months amounted to $3.33 (2016: $3.32), while for the EPS for quarter was $1.43 (2016: $0.86). The twelve months trailing earnings per share amounted to $4.03. The number of shares used in our calculations is 994,886,892 units.
Total Comprehensive Income for the period amounted to $3.46 billion compared to $5.05 billion in 2016. This was due to a Gain of Remeasurements of post-employment benefit obligations of $917.26 million relative to a loss of $914.70 million in 2017.
Balance Sheet Highlights:
As at September 30, 2017, the company’s assets totaled $129.66 billion, 6% or $7.08 billion more than its value a year ago. The improvement resulted in part from a growth Cash and deposits by $3.25 billion to total $14.05 billion (2016: $10.79 billion). Loans Receivables increased $2.13 billion to close at $26.58 billion relative to the $24.45 billion reported in 2016.
Shareholders’ equity amounted to $44.45 billion which compares to equity of $41.95 billion as at September 30, 2016. As a result, book value per share amounted to $44.68 (2016: $42.17).