
NCB Financial Group Limited (NCBFG) for year ended September 31, 2017, recorded a 6% increase in Net Interest Income relative to the corresponding period in 2016, to total $29.76 billion (2016: $28.12 billion). For the quarter Net Interest Income also improved 6% to close at $7.57 billion (2016: $7.13 billion). Interest Income for the year rose 9% year over year to $42.84 billion compared to $39.16 billion in 2016, while interest expense amounted to $13.08 billion relative to $11.03 billion for the corresponding period in 2016.
Net Fees and Commission Income amounted to $13.89 billion, an increase of 27% versus 2016’s $10.94 billion. The company highlighted, This growth was underpinned by our strategic focus on sales and service effectiveness resulting in a 34% improvement in credit related fees due to the growth in the loan portfolio, coupled with transaction growth in point of sale, e-commerce, unit trust and investment banking activities. Additionally, fee income increased in our Pension Fund Management business.” The bank also reported a gain on foreign currency and investment activities of $7.73 billion, a growth of 63% relative to $4.74 billion in 2016. Premium income for the year increased 1% to $7.57 billion (2016: $7.48 billion), while dividend income rose 97% to a total of $295.12 million (2016: $149.92 million).
Other Operating Income climbed by 67% to $229.07 million (2016: $137.35 million). Consequently, total operating income increased 15% to a total of $59.47 billion (2016: $51.57 billion). Total operating income for the fourth quarter recorded a 13% growth to $15.26 billion (2016: $13.48 billion).
Total Operating Expenses for the year amounted to $38.32 billion, an increase of 14% compared to the $33.47 billion reported in 2016. Expenses for the quarter rose 33% to close at $10.31 billion compared to $7.76 billion in 2016. According to NCBFG, “we continue to invest in ways to further improve our operating model, enable our business segments to capitalise on growth opportunities and to better serve our customers, including introducing innovative digital options. These investments will initially impact resourcing and infrastructure costs in the short-term but are expected to improve efficiency and customer experience over the medium to long-term.” The increase was due to staff costs and other operating expenses. Of these expenses: staff costs increased 19% to $16.46 billion relative to $13.81 billion in 2016, while other operating expenses grew by 9% to $14.59 billion (2016: $13.38 billion).
Provision for credit losses rose 19% to $729.23 million (2016: $612.36 million), while depreciation and amortization grew by 24% to $2.36 billion (2016: $1.90 billion). Policyholders’ and annuitants’ benefits and reserves recorded a growth of 11% to $14.18 billion relative to $3.78 billion for the prior year’s corresponding period.
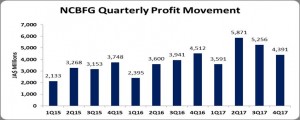
Consequently, operating profit increased 17% to total $21.16 billion (2016: $18.10 billion). ‘Share of profit of associates’ surged by 242% to total $2.85 billion compared to $832.48 million in 2016. The bank noted, “our 29.99% shareholding in Guardian Holdings Limited was the main contributor to the $2.0 billion increase in share of profit of associates..” Consequently, profit before taxation increased 27% to $24.01 billion relative to $18.93 billion in 2016. After accounting for taxation of $4.90 billion (2016: $4.48 billion), net profit for the year totalled $19.11 billion, an increase of 32% compared to $14.45 billion for the prior year. Net profit for the fourth quarter declined by 3% to close at $4.39 billion (2016: $4.51 billion).
Total comprehensive income for the year amounted to $19.54 billion (2016: $20.49 billion), while $5.54 billion (2016: $7.81 billion) was recorded for the quarter.
Earnings per share (EPS) for the year end totalled $7.75 relative to $5.86 booked for 2016. The EPS for the fourth quarter amounted to $1.78 (2016: $1.83). The number of shares used in our calculations amounted to 2,466,762,828 units.
Balance Sheet at a glance:
Total Assets increased by 14% or $86.05 billion to $693.72 billion as at September 30, 2017 from $607.67 billion a year ago. This increase stemmed mainly from the growth in ‘Cash in hand & balances at Central Bank’ from $35.37 billion to $65.31 billion, an 85% increase. Other notable contributors to the increase in the asset base was ‘Loans & advances, net of provision for credit losses’ which rose 16% to $218.62 billion relative to $189.06 billion for the corresponding period in 2016.
Shareholder’s Equity as at September 30, 2017 stood at $116 billion relative to $103.11 billion a year ago. This resulted in book value per share of $47.02 (2016: $41.80).
The information contained herein has been obtained from sources believed to be reliable, however its accuracy and completeness cannot be guaranteed. You are hereby notified that any disclosure, copying, distribution or taking any action in reliance on the contents of this information is strictly prohibited and may be unlawful. Mayberry may effect transactions or have positions in securities mentioned herein. In addition, employees of Mayberry may have positions and effect transactions in the securities mentioned herein.


