AMG recorded Turnover in the amount of $487.02 million (2016: $463.31 million), an increase of $23.71 million when compared to that recorded the year prior. For the third quarter Turnover totaled $174.53 million up 10% from the $158.35 million in 2016.
Total manufacturing costs amounted to $350.97 million, an increase of 9% relative to the corresponding period in 2016 of $320.62 million. Cost of inventories increased by 9% to $255.79 million (2016: $235.68 million) while direct expenses rose by 12% to total $95.17 million (2016: $84.94 million). Total Manufacturing Cost for the third quarter amounted to $125.90 million up 10% relative to the $114.61 million booked in 2016.
Consequently, Gross Profit declined by 5%, amounting to $136.05 million, down from $142.69 million in the corresponding period of 2016.
Administrative expenses increased by 30% to close at $57.60 million (2016: $44.37 million). Preliminary expenses for the toilet paper operations was nil relative to $6.37 million. This while Depreciation Expense recorded a 29% increase to $18.37 million (2016: $14.29 million). Financial expenses increased by 2% to $9.16 million relative to $8.94 million in 2016. Director’s Fees amounted to $2.38 million relative to $6.22 million in 2016
As such, Pre-tax profit closed at $44.70 million for the nine months, 30% less than the $63.58 million booked for the corresponding period in 2016.
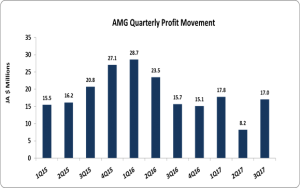
Including ‘Other Income’ of $3.41 million (2016: $4.25 million), Net Profit amounted to $41.32 million (2016: $67.83 million) after tax charges of $6.79 million. On the issue of revenue AMG remarked, “this was mainly due to the under performance of the toilet paper segment.” For the third quarter, Net Profits reported were $14.34 million down 8% from the $15.66 million in 2016.
Consequently earnings per share for the nine months amounted to $0.08 (2016: $0.13). EPS for the quarter amounted to $0.028 (2016:$0.031). The twelve months trailing EPS is $0.11. The total number of shares used in this calculation was 511,894,285 units.
Balance Sheet Highlights:
As at May 31, 2017, Total Assets amounted to $637.08 million, 9.8% more than its value a year ago. This increase in total assets was driven mainly by an increase in Inventories, which totaled $222.72 million (2016: $153.07 million).
Shareholder’s Equity as at May 2017 totaled $419.5 million (2016: $406.03 million) resulting in a book value per share of approximately $0.82 (2016: $0.79).