
February 15, 2022
For the first quarter ended December 31, 2021, Barita Investments Limited (BIL) net interest income rose by 29% amounting to $472.69 million relative to $367.38 million for the comparable quarter in 2020. “This increase was driven focused on expanding the Group’s credit and fixed income portfolios through the efficient deployment of on-balance sheet funds under management,” as per Barita.
Dividend Income fell 15% to total $381,000 compared to the $449,000 earned for the first three months ended December 31, 2020. Gains on sale of investment declined 55% to $300.79 million (2020: $669.36 million), while Fees & Commissions Income rose 9% to close at $505.53 million (2020: $465.62 million).
Foreign exchange trading and translation amounted to a gain of $784.38 million compared to a gain of $485.76 million recorded in the previous year. Other income amounted to $7.92 million, 61% up from $4.92 million booked in 2020. As such, net operating revenue amounted to $2.07 billion relative to $1.99 billion recorded for the comparable period in 2020.
Administrative Expenses for the period amounted to $364.50 million, increasing 11% from $327.42 million in 2020. Staff costs for the quarter rose 11% from $279.19 million booked in 2020 to $310.93 million in 2021.
BIL for the quarter reported $53.03 million for impairment, relative to the $72.72 million reported a year prior.
Profit before tax amounted to $1.38 billion relative to a profit before taxation of $1.31 billion in 2020.
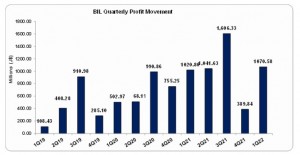
Following taxation of $305.77 million (2020: $293.37 million), the company reported net profit of $1.07 billion, relative to net profit of $1.02 billion booked in 2020.
Earnings per Share for the first quarter ended December 31, 2021, totalled $0.99 relative to an earnings per share of $0.94 in 2020. The trailing earnings per share amounted to $3.78. The number of shares used in our calculations amounted to 1,085,603,093 units. BIL stock price closed the trading period on February 14, 2022 at $91.34 with a correspond P/E ratio of 24.14 times.
Balance Sheet at a glance:
As at December 31, 2021, total assets amounted $91.98 billion (2020: $69.94 billion), a $22.04 billion improvement as a result of the growth in “Marketable Securities” which increased by $12.97 billion to a total of $22.41 billion (2020: $9.43 billion) and “Pledged Assets” which rose by $11.44 billion to $49.06 billion (2020: $37.62 billion).
Shareholders’ Equity amounted to $36.79 billion relative to $28.50 billion in 2020 resulting in a book value per share of $44.72 relative to $34.55 in 2020.
Disclaimer:
Analyst Certification -The views expressed in this research report accurately reflect the personal views of Mayberry Investments Limited Research Department about those issuer (s) or securities as at the date of this report. Each research analyst (s) also certify that no part of their compensation was, is, or will be, directly or indirectly, related to the specific recommendation(s) or view (s) expressed by that research analyst in this research report.
Company Disclosure -The information contained herein has been obtained from sources believed to be reliable, however its accuracy and completeness cannot be guaranteed. You are hereby notified that any disclosure, copying, distribution or taking any action in reliance on the contents of this information is strictly prohibited and may be unlawful. Mayberry may effect transactions or have positions in securities mentioned herein. In addition, employees of Mayberry may have positions and effect transactions in the securities mentioned herein.

