Date: April 1, 2019
Everything Fresh Limited (EFRESH), audited results for the year ended December 31, 2018 reported that Revenue grew by 4% for the period amounting to $1.88 billion, up from $1.81 billion reported a year ago. For the fourth quarter, revenues totaled of $488.68 million, a 10% increase when compared to last period’s $443.15 million.
Cost of sales closed the period at $1.66 billion (2017: $1.58 billion) which translated into a gross profit of $218.71 million (2017: $229.05 million). For the fourth quarter, gross profit grew by 187% to $99.69 million relative to $35.05 million in 2017.
Other operating income declined by 12% for the period to $2.22 million from $2.52 million reported the prior year.
Operating expenses totaled $188.64 million, 8% more than the $174.35 million booked the previous year. Of this, administrative expenses rose to $177.99 million (2017: $171.33 million), while selling and promotion expenses amounted to $10.65 million (2017:$3.03 million). In addition, finance costs amounted to $13.53 million in comparison to 2017’s $11.85 million.
Profit before tax declined 59% for the period totaling $18.76 million in comparison to 2017’s $45.37 million.
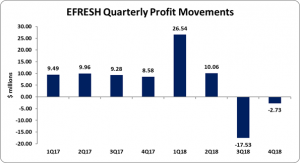
Following taxation of $2.42 million (2017: $8.07 million), net profit of $16.34 million was booked for the period relative to $37.30 million for the corresponding period in 2017. However, for the quarter a net loss of $2.73 million was booked compared to a net profit of $8.58 million in the previous year.
Consequently, earnings per share (EPS) amounted to $0.021 (2017: $0.048), while loss per share for the quarter amounted to $0.004 versus an EPS of $0.011 in 2017. The number of shares used in this calculation was 780,000,000 shares. EFRESH stock price closed the trading period at a price of $1.51 on April 1, 2019.
Balance sheet at a Glance:
Total Assets grew by 78% or $382.72 million to close at $873.96 million as at December 30, 2018 (2017: $491.24 million). This surge in total assets was largely due to the $120.36 million booked for ‘Deposit on short term deposit’ (2017: nil).‘Cash and Cash Equivalents’ also contributed to this growth by $119.11 million, totaling $184.90 million (2017: $65.79 million).
Shareholder’s equity totaled $623.28 million compared to the $243.02 million the prior year. This resulted in a book value of $0.79 (2017: $0.31).
Analyst Certification -The views expressed in this research report accurately reflect the personal views of Mayberry Investments Limited Research Department about those issuer (s) or securities as at the date of this report. Each research analyst (s) also certify that no part of their compensation was, is, or will be, directly or indirectly, related to the specific recommendation (s) or view (s) expressed by that research analyst in this research report.
Company Disclosure -The information contained herein has been obtained from sources believed to be reliable, however its accuracy and completeness cannot be guaranteed. You are hereby notified that any disclosure, copying, distribution or taking any action in reliance on the contents of this information is strictly prohibited and may be unlawful. Mayberry may effect transactions or have positions in securities mentioned herein. In addition, employees of Mayberry may have positions and effect transactions in the securities mentioned herein.