
Brent Oil
Brent oil prices decreased by 1.63 % or US$1.27, as prices fell this week. Oil traded on June 7, 2018 at a price of $76.45 per barrel relative to US$77.72 last week. Brent oil began the year at US$68.07 per barrel.
Petrojam prices
87 Octane prices decreased week over week, by 0.47% (JMD$0.62). Additionally 90 Octane declined by 0.46% or (JMD$0.62) week over week. 87 Octane and 90 Octane opened the year at J$121.04 and J$123.88 respectively and now trades at J$132.33 and J$135.17 per litre respectively.
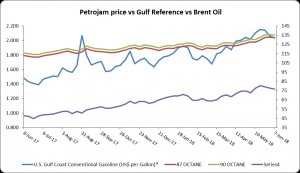
Figure 1: Petrojam, U.S. Gulf Coast Conventional Gasoline Regular and Brent Crude Oil 1 Year Price History
This Week in Petroleum
Reduction in U.S. average regular gasoline and diesel prices
“The U.S. average regular gasoline retail price went down 2 cents from last week to $2.94 per gallon on June 4, 2018. This increased by 53 cents compared to the same time last year. Prices within the Midwest and East declined over three cents each to $2.85 per gallon and $2.88 per gallon, respectively, and West Coast prices inched down, remaining at $3.46 per gallon. Rocky Mountain and Gulf Coast prices each increased less than a penny to $3.00 per gallon and $2.73 per gallon, respectively.”
“The U.S. average diesel fuel price went down by less than a penny,72 cents higher than a year ago, flat at $3.29 per gallon on June 4, 2018. For prices in Midwest and East Coast each fell nearly one cent to $3.22 per gallon and $3.28 per gallon, respectively, while West Coast prices were remained the same at $3.78 per gallon. Rocky Mountain prices increased nearly one cent to $3.36 per gallon and Gulf Coast prices increased slightly to $3.06 per gallon.”
Propane/propylene inventories rise
“U.S. propane/propylene stocks went up by 4.0 million barrels last week to 47.1 million barrels as of June 1, 2018, 12.0 million barrels (20.3%) lower than the five-year average inventory level for this same time of year. Gulf Coast, Midwest, and Rocky Mountain/West Coast inventories inched up by 2.8 million barrels, 1.6 million barrels, and 0.2 million barrels, respectively, while East Coast inventories decreased by 0.6 million barrels. Propylene non-fuel-use inventories represented 6.3% of total propane/propylene inventories.”
For additional information click the link below:
Disclaimer:
Analyst Certification -The views expressed in this research report accurately reflect the personal views of Mayberry Investments Limited Research Department about those issuer (s) or securities as at the date of this report. Each research analyst (s) also certify that no part of their compensation was, is, or will be, directly or indirectly, related to the specific recommendation (s) or view (s) expressed by that research analyst in this research report.
Company Disclosure -The information contained herein has been obtained from sources believed to be reliable, however its accuracy and completeness cannot be guaranteed. You are hereby notified that any disclosure, copying, distribution or taking any action in reliance on the contents of this information is strictly prohibited and may be unlawful. Mayberry may effect transactions or have positions in securities mentioned herein. In addition, employees of Mayberry may have positions and effect transactions in the securities mentioned herein.


