May 17, 2019
General Accident Insurance Company Limited (GENAC) for the three months ended March 31, 2019, reported Gross premium written of $2.69 billion, 22% higher than the $2.21 billion reported for 2018. Reinsurance ceded rose 21% to close at $2.11 billion relative to $1.75 billion booked in 2018. Excess of loss reinsurance trended downwards by 2% to $30.25 million (2018: $30.77 million).
As a result, net premium written increased by 26% from $430.59 million last year to $543.08 million.
Net changes in unearned premiums totaled $57.72 million, 12% lower than the $65.93 million recorded last year. Consequently, net premiums earned grew by 33% to a total of $485.36 million compared to $364.66 million for the prior year.
Commission income grew by 26%, year over year, from $187.30 million in 2018 to $236.18 million in 2018, while commission expenses increased by 25% from $115.72 million to $144.08 million.
Claims expenses saw an increase of 19%, closing the quarter at $294.21 million (2018: $248.08 million), while management expenses climbed by 12% to total $192.26 million compared to 2018’s total of $172.31 million.
Underwriting profit for the quarter totaled of $41.82 million, this compares to a loss of $7.26 million booked for the first three months of 2018.
Investment income closed at $31.01 million, a 28% decline when compared with last year’s corresponding quarter of $43.24 million, while other losses totaled $24.46 million for the quarter, relative to an income of $9.09 million in 2018. Other operating expenses grew by 11% to $11.32 million relative to $10.20 million in 2018.
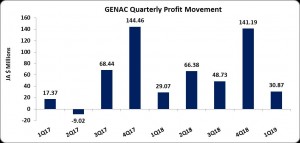
Profit before taxation amounted to $37.05 million (2018: $34.88 million). Following taxes of $6.17 million (2018: $5.81 million), Net profit totaled $30.87 million for the quarter, an increase of 6% compared to the $29.07 million reported last year.
Total comprehensive loss amounted to $2.38 million (2018: $32.73 million) for the quarter ended March 31, 2019.
As such, earning per share for the period amounted to $0.030 (2017: $0.28). The trailing twelve months EPS amounted to $0.29. The stock traded at $4.11 as at May 17, 2019. The number of shares used in our calculations amounted to 1,031,250,000 units.
Balance Sheet at a glance:-
Total Assets increased by 18% to $7.53 billion as at March 31, 2019 from $6.39 billion a year earlier. ‘Investment Securities’ contributed the most to the growth in assets with a 42% increase to $2.82 billion relative to $1.986 billion in 2018. Due from reinsurers and coinsurers also contributed to the increase with a 41% growth year over year to close at $1.90 billion (2018: $1.35 billion). However this was offset by the decline ‘Cash & Short Term Investments’ by $206.68 million to close the period at $436.69 million (2018: $643.37 million).
Shareholder’s Equity as at March 31, 2019 stood at $2.05 billion (2018: $1.95 billion) resulting in book value per share of $1.99 (2017: $1.89).
Disclaimer:
Analyst Certification -The views expressed in this research report accurately reflect the personal views of Mayberry Investments Limited Research Department about those issuer (s) or securities as at the date of this report. Each research analyst (s) also certify that no part of their compensation was, is, or will be, directly or indirectly, related to the specific recommendation (s) or view (s) expressed by that research analyst in this research report.
Company Disclosure -The information contained herein has been obtained from sources believed to be reliable, however its accuracy and completeness cannot be guaranteed. You are hereby notified that any disclosure, copying, distribution or taking any action in reliance on the contents of this information is strictly prohibited and may be unlawful. Mayberry may effect transactions or have positions in securities mentioned herein. In addition, employees of Mayberry may have positions and effect transactions in the securities mentioned herein.