
Date: November 15, 2018
General Accident Insurance Company Limited (GENAC), for the nine months ended September 30, 2018 reported Gross premium written of $7.40 billion, 20% higher than the $6.18 billion reported for 2017. As a result, net premium written increased by 26% from $1.04 billion last year to $1.32 billion. Excess of loss reinsurance remained at $70.38 million, the same as 2017. Net premium written for the third quarter amounted to $478.73 million relative to $369.96 million booked for the corresponding period in 2017.
Reinsurance ceded amounted to $6.01 billion relative to $5.07 billion in 2017, a 19% increase year over year.
Net changes in unearned premiums totaled $120.45 million, 54% higher than the $78.18 million recorded the previous year. Consequently, net premiums earned grew by 24% to a total of $1.20 billion compared to $965.12 million for the same period last year. For the quarter, net premium earned totaled $430.90 million compared to $347.35 million booked for the similar quarter of 2017.
Commission income grew by 51%, year over year, from $328.66 million in 2017 to $494.97 million in 2018, while commission expenses also went up by 32% from $236.04 million to $312.28 million.
Claims expenses saw an increase of 10%, closing the period at $865.94 million (2017: $788.15 million), while management expenses climbed by 35% to total $553.88 million (2017: $409.56 million). GENAC noted that one contributing factor to the rise in expenses was the growth in Administrative expenses, “due to new hires to drive the strategic plan.”
Net change in commission totaled $11.26 million for the nine months compared to $105.15 million booked in 2017.
Underwriting loss for the period totaled of $27.70 million, this compares to a loss of $34.83 million in 2017. The company also made an underwriting loss of $20.02 million for the third quarter when compared to a profit of $33.15 million in 2017.
In addition, investment income closed at $228.73 million, a 56% increase when compared with last year’s $146.33 million, while other income totaled $4.51 million, (2017: $1.95 million). Other operating expenses grew by 45% to $32.46 million when compared to $22.41 million in 2017.
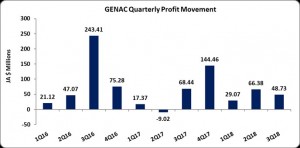
As such, profit before taxation amounted to $173.08 million (2017: $91.04 million). Net Profit totaled $144.18 million for the period, an 88% uptick when compared to the $76.78 million reported last year, subsequent to tax charges of $28.91 million.
However, net profit for the quarter was $48.73 million, a 29% drop versus the same period of 2017 which had net profits of $68.44 million.
Total comprehensive income amounted to $126.14 million (2017: $130.42 million), following a loss on available investments for sale of $18.03 million (2017: Gain of $53.64 million).
As such, Earning per share for the period amounted to $0.14 (2017: $0.07) while EPS for the quarter amounted to $0.05 compared to $0.07 in 2017. The twelve months trailing EPS is $0.28. The stock traded at $3.97 as at November 15, 2018. The number of shares used in our calculations amounted to 1,031,250,000 units.
According to the company, “Despite, low interest rates and increased competition in a very challenging operating environment. For the first nine months of the year, we were able to improve on our performance when compared to the similar period for 2017. The board and management team are committed to ensuring that General Accident’s financial performance continues to improve for the remainder of the year.”
Balance Sheet at a glance:-
Total Assets increased by 25% to $6.71 billion as at September 30, 2018 from $5.37 billion a year ago. This was driven by the increase in ‘Investment Securities’ to total $2.24 million for the period. Despite the increase, there was a $1.80 billion reduction in Investment Properties which would have tempered with the total asset base, which closed the period at $130 million.
Shareholder’s Equity as at September 30, 2018 stood at $2.05 billion (2016: $1.89 billion) resulting in book value per share of $1.99 (2017: $1.84).
Disclaimer: Analyst Certification -The views expressed in this research report accurately reflect the personal views of Mayberry Investments Limited Research Department about those issuer (s) or securities as at the date of this report. Each research analyst (s) also certify that no part of their compensation was, is, or will be, directly or indirectly, related to the specific recommendation (s) or view (s) expressed by that research analyst in this research report.
Company Disclosure -The information contained herein has been obtained from sources believed to be reliable, however its accuracy and completeness cannot be guaranteed. You are hereby notified that any disclosure, copying, distribution or taking any action in reliance on the contents of this information is strictly prohibited and may be unlawful. Mayberry may effect transactions or have positions in securities mentioned herein. In addition, employees of Mayberry may have positions and effect transactions in the securities mentioned herein.


