
Date: November 15, 2018
Sweet River Abattoir & Supplies Company Limited (SRA), For the six months ended September 30, 2018 recorded a 19% decline in revenue to $134.58 million relative to $165.45 million in the same period in 2017. Revenue for the quarter went down 22% to close at $57.52 million relative to $73.70 million. SRA indicated, “this decrease was due to the company’s inability to procure pigs from farmers based on its indebtedness to compare to the previous period of two thousand four hundred and two pigs.”
Cost of sales fell 14% from $133.19 million in 2017 to $114.31 million in 2018. As a result, gross profit increased to $20.27 million, a 37% decline when compared to $32.25 million for the same period of 2017. Gross profit for the quarter also fell to $12.80 million compared to $15.96 million reported in 2017. SRA reported that the decline was, “mainly due to a reduction in supplies from farmers and the introduction of a contract with a third party to supply our main customer at a smaller mark-up.”
Administrative expenses reported an increase of 12% from $22.77 million for the first six months of 2017 to $25.62 million in the corresponding quarter of 2017. Management noted, “this increase was due to higher running cost at the new factory and servicing our loan.”
Consequently, SRA recorded operating loss for the period of $5.35 million relative to operating profit of $9.48 million booked for the prior year.
Finance costs closed the period at $6.14 million, an decrease of 32% when compared to $9.06 million for the corresponding period last year, while finance income totalled $15,163 (2017: $637).
Furthermore, loss before taxation amounted to $11.48 million versus profits of $414,481 in 2017.
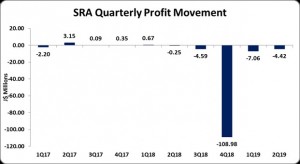
As a result, SRA recorded a net loss of $11.48 million for the six months ended September 30, 2018 relative to a profit of $414,481 in 2017. The company booked a loss for the quarter of $4.42 million relative to losses of $254,606 for the comparable quarter in 2016.
The loss per share (LPS) for the quarter amounted to $0.054 versus an LPS of $0.003 for the corresponding period last year. The LPS for the period totalled $0.141 compared to an EPS of $0.005 for the similar period of 2017. The twelve months trailing loss per share is $1.53. The number of shares used in this calculation was 81,531,043 units. The stock price last traded on November 15, 2018 at $3.50.
SRA noted, “we are confident that the third quarter, often as the ham season, and which also includes the start of the winter tourist season will be better as it historically the best period for pork sales. Concurrently, our entry in the hotel markets is also expected to significantly increase our sales. With the winter tourist season running from December to May the fourth quarter will also benefit from this spike in demand.”
While we are expecting come revenue growth recovery in the third and fourth quarters we are also cognizant that must control costs while increasing output by improving inefficiencies at the plant. We have also begun discussion with some of our key farmers with the view of a collective purchasing of raw materials thus the benefit from economy of scale. The sharing of best practice and technology amongst farmers has begun and will be expanded moving forward. The overall objective is for us to control the cost of pork to the consumer making it more affordable.”
Balance Sheet Highlights:
As at September 30, 2018, SRA recorded total assets of $400.57 million, an decrease of 10% when compared to $446.26 million for the 2017 quarter one period. The decline in the total asset base was attributed to Property, Plant and Equipment which dipped 15% to $328.66 million (2017: $386.35 million) along with a $14.31 million decrease in Inventories which ended the period at $2.69 million (2017: $17 million).
Total stockholders’ equity as at September 30, 2018 closed at $37.68 million, down 77% from $163.10 million last year. This resulted in a book value of $0.46 compared to a 2016 value of $2.00 a year earlier.
Disclaimer: Analyst Certification -The views expressed in this research report accurately reflect the personal views of Mayberry Investments Limited Research Department about those issuer (s) or securities as at the date of this report. Each research analyst (s) also certify that no part of their compensation was, is, or will be, directly or indirectly, related to the specific recommendation (s) or view (s) expressed by that research analyst in this research report.
Company Disclosure -The information contained herein has been obtained from sources believed to be reliable, however its accuracy and completeness cannot be guaranteed. You are hereby notified that any disclosure, copying, distribution or taking any action in reliance on the contents of this information is strictly prohibited and may be unlawful. Mayberry may effect transactions or have positions in securities mentioned herein. In addition, employees of Mayberry may have positions and effect transactions in the securities mentioned herein.


