
March 02, 2020
GraceKennedy Limited (GK) recorded revenue of $103.09 billion for the period (2018: $97.54 billion), a year over year increase of 6%. Revenue for the quarter of 2019 improved by 10% to $26.06 billion (2018: $23.72 billion). GK highlighted that, “this is a historic achievement, the first time that the Group has surpassed the J$100 billion mark for revenue, ahead of our original target of 2022, which will be the Group’s 100th anniversary.”
Management noted that, “Our operational strategy for 2019 was focused on investing in our brands and expanding market share, deploying digital and innovative solutions for our customers. The Group continued to enhance its enterprise wide risk management and compliance processes and drive greater operational efficiencies within the Group. GraceKennedy Limited has positioned itself for future growth with the on-going implementation of transformational structural and process improvement initiatives.” Furthermore, “All business segments recorded increased revenue and profits for 2019 compared to 2018,” as per Management. Segment report is as followed:
- The Food Trading segment reported revenues of $81.44 billion, up 6% relative to the $77.11 billion reported in 2018. Management noted, “Our Jamaican food distribution business experienced double digit growth in both revenue and pre-tax profit coupled with improved operating margins with most of our core products reporting higher sales when compared to 2018.
- Banking & Investments produced revenues of $6.16 billion compared to $5.77 billion reported in 2018. According to management, “The Banking and Investments segment reported an increase in revenue and pre-tax profit for 2019 compared to 2018. The customer loan portfolio increased by 15.9% compared to 2018 as First Global Bank (FGB) placed greater emphasis on developing products and capacity building activities for small and medium-sized enterprises; automated its loan approval process and continued its focus on relationship building.
- The Insurance segment posted a 9% growth in revenue year over year to close at $7.58 billion relative to $6.98 billion documented in 2018. According to GK, “The segment continues to perform well with existing operations achieving growth and various new initiatives forming a base for future growth.
- The Money Services segment managed to grow revenues by 3% to $7.91 billion (2018: $7.69 billion). The performance according to GK was due to the execution, “of its objective of enhanced customer convenience through digital offerings, which have showed increasing adoption by customers since their introduction. These offerings include WU.com, a digital money transfer platform which allows customers 24/7 access to send funds electronically to over 200 countries, Direct to Bank where customers can receive money through Western Union for deposit to their bank accounts, and Pay@WU which allows customers to pay for Amazon orders at more than 50 Western Union locations in Jamaica.”
Total expenses amounted to $99.35 billion relative to $94.40 billion booked in 2018, indicating a 5% growth compared to twelve months earlier. Expenses for the quarter amounted to $25.20 billion, up from $22.79 billion for the same quarter in 2018. As such, gross profit for the year end amounted to $3.74 billion relative to $3.14 billion booked for the comparative period of 2018. Gross profit for the quarter closed at $858.43 million compared to $928.04 million reported for the quarter of 2018.
Other income for the year-end period fell by 28% to total $2.52 billion (2018: $3.49 billion). While for the quarter, other income closed at $593.14 million relative to $1.22 billion in the prior corresponding period.
Operating profit amounted to $6.26 billion relative to $6.63 billion for the year ended December 31, 2018. Whilst for the fourth quarter ended December 31, 2019, operating profit totalled $1.45 billion relative to $2.15 billion in 2018.
Interest income from non-financial services rose 2% to total $437.40 million compared to $427.50 million reported in the prior year’s corresponding period. Interest expenses from non-financial services amounted to $1.09 billion versus $581.87 million a year earlier, a 87% increase.
Share of results of associated companies totalled $518.89 million, compared to $490.87 million reported for December 2018.
Pretax profits decreased by 12% to approximately $6.13 billion compared to pre-tax profit of $6.96 billion documented for the year ended December 2018. Additionally, GK incurred taxation expenses amounting to $1.03 billion compared to $1.32 billion in the prior corresponding quarter.
Moreover, GK noted that, “in 2018 the Group had non-recurring gains of J$1.13 billion from the dissolution of a non-operating subsidiary and an acquisition by an associated company. Excluding these gains in 2018, together with the IAS 19 and IFRS 16 expenses noted above, Profit before Tax for the year 2019 would have been higher than 2018 by J$1.42 billion or 23%.”
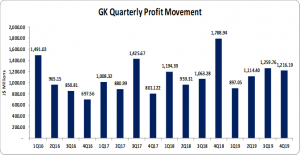
Consequently, net profit decreased by 10% to $5.10 billion from $5.64 billion booked for the corresponding period of 2018. For the quarter, net profit closed at $1.39 billion (2018: $1.93 billion).
Net Profits attributable to shareholders amounted to $4.49 billion compared to $5.01 billion in the previous year’s corresponding period. Net profit attributable to shareholders for the quarter amounted to $1.22 billion, down from $1.79 billion booked for the same quarter of 2018.
Earnings per share for the period amounted to $4.51 (2018: $5.03), while for the quarter, GK booked an EPS of $1.22 (2018: $1.80). The number of shares used in our calculations is 995,004,356 units. GK’s stock price closed the trading period on March 02, 2020 at $66.23.
Balance Sheet Highlights:
As at December 31, 2019, the company’s assets totalled $154.71 billion, 14% or $19.47 billion more than the $135.24 billion booked a year ago. The improvement resulted from growth in ‘Fixed Assets’ and ‘Loan Receivables’ which closed at $24.07 billion (2018: $14.30 billion) and $30.68 billion (2018: $26.47 billion), respectively. ‘Investment Securities’ and ‘Pension plan assets’ of $30.67 billion (2018:$28.26 billion) and $5.82 billion (2018: $3.27 billion) also contributed to the increase in assets.
Total Shareholders’ equity amounted to $52.33 billion which compares to equity of $44.61 billion as at December 2018. As a result, book value per share amounted to $52.60 (2018: $44.84).
Analyst Certification -The views expressed in this research report accurately reflect the personal views of Mayberry Investments Limited Research Department about those issuer (s) or securities as at the date of this report. Each research analyst (s) also certify that no part of their compensation was, is, or will be, directly or indirectly, related to the specific recommendation (s) or view (s) expressed by that research analyst in this research report.
Company Disclosure -The information contained herein has been obtained from sources believed to be reliable, however its accuracy and completeness cannot be guaranteed. You are hereby notified that any disclosure, copying, distribution or taking any action in reliance on the contents of this information is strictly prohibited and may be unlawful. Mayberry may effect transactions or have positions in securities mentioned herein. In addition, employees of Mayberry may have positions and effect transactions in the securities mentioned herein.


