
October 26, 2020
As at the end of the second quarter of 2020, the government debt to GDP ratio for the euro area was 95.1% relative to 86.3% at the end of the first quarter of 2020. Notably, Q2 2020 was the quarter in which the impacts of the containment measures as well as policy responses to the containment measures fully materialised in increased financing needs. According to a report published by Eurostat, the statistical office of the European Union, “In the EU, the ratio increased from 79.4% to 87.8%. Compared with the second quarter of 2019, the government debt to GDP ratio rose in both the euro area (from 86.2% to 95.1%) and the EU (from 79.7% to 87.8%).”
In addition, debt securities accounted for 81.6% of euro area and for 81.4% of EU general government debt at the end of the second quarter of 2020. Whereas, loans constituted 15.1% and 15.4% in the euro and EU, respectively. Currency and deposits consisted of 3.3% of the euro area and 3.2% of the EU government debt.
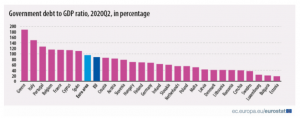
Government debt at the end of the second quarter 2020 by Member State
Notably, at the end of the second quarter of 2020, the highest ratios of government debt to GDP were observed in Greece (187.4%), Italy (149.4%), Portugal (126.1%), Belgium (115.3%), France (114.1%), Cyprus (113.2%) and Spain (110.1%), and the lowest in Estonia (18.5%), Bulgaria (21.3%) and Luxembourg (23.8%).
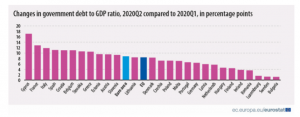
In comparison to the first quarter of 2020, all Member States experienced a rise in their debt to GDP ratio at the end of the second quarter of 2020. The highest increases in the ratio were recorded in Cyprus (+17.1 percentage points – pp), France (+12.8 pp), Italy (+11.8 pp), Spain (+11.1 pp), Croatia and Belgium (both +11.0 pp), Slovakia (+10.6 pp) and Greece (+10.5 pp).
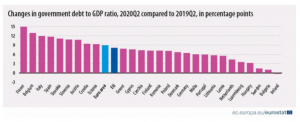
In comparison to the second quarter of 2019, all Member States reported growth in their debt to GDP ratio at the end of the second quarter of 2020 except Ireland (-0.3 percentage points). The largest increases in the ratio were recorded in France (+14.9 pp), Belgium (+12.9 pp), Italy (+11.9 pp), Spain (+11.7 pp), Slovakia (+11.1 pp), Slovenia (+10.8 pp) and Austria (+10.7 pp).
Analyst Certification -This research report is for information purposes only and should not be construed as a recommendation. Each research analyst (s) also certify that no part of their compensation was, is, or will be, directly or indirectly, related to the specific recommendation (s) or view (s) expressed by that research analyst in this research report.
Company Disclosure -The information contained herein has been obtained from sources believed to be reliable, however its accuracy and completeness cannot be guaranteed. You are hereby notified that any disclosure, copying, distribution or taking any action in reliance on the contents of this information is strictly prohibited and may be unlawful. Mayberry may effect transactions or have positions in securities mentioned herein. In addition, employees of Mayberry may have positions and effect transactions in the securities mentioned herein.


