
Grace Kennedy Limited (GK) for the six months ended June 30, 2017 reported total revenue of $46.37 billion (2016: $44.12 billion), a year over year increase of 5%. The biggest contributor to the group’s overall revenue for the six months was income from the ‘Food Trading’ segment which contributed a total of $36.29 billion (2016: $34.62 billion), an increase of 5% relative to the prior year’s corresponding period. Management noted, “revenue was primarily driven by higher sales from our Jamaican foods business. However, pre-tax profit was lower than the corresponding period of 2016 due primarily to lower margins and higher depreciation on new capital spend.” “GraceKennedy Foods (USA) LLC, our United States distribution company continues to see growth from both the Grace and La Fe brands over the corresponding period of 2016.”
-
- Among the other segments contributing to revenue, ‘Banking & Investments’ increased 8% to total $2.98 billion. GK indicated, “the Banking and Investments segment achieved growth in both revenue and pre-tax profit over prior year. First Global Bank (FGB) reported stronger growth in net interest income from increases in their deposit and loans portfolios and higher trading gains when compared to prior year.”
-
- Revenue from ‘Insurance’ amounted to $3.05 billion, a marginal decrease of 0.28%, while ‘Money Services’ brought in $4.05 billion, 10% more than the $3.68 billion reported in June 2016. Management indicated, “GK Insurance showed strong growth in its underwriting performance and has recorded double digit increase in the number of motor policies issued in Jamaica. the company, however, continues to be affected by lower rates in the property insurance market. Finance and investment income were also lower than the prior year.”
Total Expenses amounted to $44.50 billion relative to $42.14 billion booked for the comparable period in 2016, a 6% growth. Other Income declined 41% to total $903.88 million (2016: $1.54 billion). As such, ‘Profit from Operations’ amounted to $2.78 billion, a 21% decline year over year from $3.52 billion booked in June 2016.
Interest income from non-financial services rose 3% to total $187.37 million compared to $182.21 million reported a year earlier. Interest expenses from non-financial services amounted to $334.45 million versus $350.60 million booked for the corresponding period in 2016, a 5% reduction.
Share of results of associated companies increased by 6% amounting to $320.22 million, compared to $300.86 million reported for June 2016.
Pre-tax profits decreased 19% to approximately $2.95 billion, compared to pre-tax profit of $3.65 billion documented for the first six months of 2016. GK incurred taxation expenses amounting to approximately $767.64 million compared to $949.09 million in June 2016. Consequently, net profit decreased by 19% to $2.18 billion from $2.70 billion booked for the first six months of 2016.
Net Profits attributable to shareholders amounted to $1.90 billion compared to $2.46 billion a year earlier, reflecting a 23% decline. According to GK this, “was due to a non-recurring gain in 2016. As previously reported, this non-recurring gain was realised on the liquidation of some non-operating subsidiaries for the corresponding period of 2016. Without this, net profit for the current period would have been lower than the corresponding period of 2016 by 5.5%. Despite this, we are ahead of plan for the period as factors such as costs associated with the expansion were taken into account in our 2017 planning process. The Group is on track for improved operating performance over prior year.
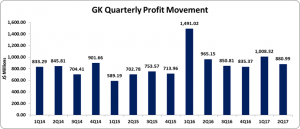
Earnings per share (EPS) for first six months amounted to $1.90 (2016: $2.47), while for the EPS for quarter was $0.89 (2016: $0.97). The twelve months trailing earnings per share amounted to $3.59. The number of shares used in our calculations is 994,886,892 units.
Balance Sheet Highlights:
As at June 30, 2017 the company’s assets totalled $127.17 billion, 6% or $7.43 billion more than its value a year ago. The improvement resulted in part from a growth in ‘Loan Receivables’ by $2.55 billion. Pledged assets as at June 30, 2017 amounted to $26.58 billion (2016: $24.03 billion).
Shareholders’ equity amounted to $44.20 billion which compares to equity of $40.77 billion as at June 30, 2016. As a result, book value per share amounted to $44.43 (2016: $40.98).
Disclaimer:
Analyst Certification -This research report is for information purposes only and should not be construed as a recommendation. Each research analyst (s) also certify that no part of their compensation was, is, or will be, directly or indirectly, related to the specific recommendation (s) or view (s) expressed by that research analyst in this research report.
Company Disclosure -The information contained herein has been obtained from sources believed to be reliable, however its accuracy and completeness cannot be guaranteed. You are hereby notified that any disclosure, copying, distribution or taking any action in reliance on the contents of this information is strictly prohibited and may be unlawful. Mayberry may effect transactions or have positions in securities mentioned herein. In addition, employees of Mayberry may have positions and effect transactions in the securities mentioned herein.


