National Commercial Bank of Jamaica Limited (NCBJ)
For The Nine Months Ended June 30, 2017 Net Interest Income increased by 5%, relative to the corresponding period in 2016, to total $22.19 billion (2016: $21.04 billion). For the quarter, Net Interest Income for improved 9% to close at $7.56 billion (2016: $6.92 billion). Interest income rose 8% year over year to $31.63 billion compared to $29.21 billion in 2016, while interest expense amounted to $9.44 billion relative to $8.17 billion for the corresponding period in 2016.Net Fees and Commission Income amounted to $10.42 billion, an increase of 31% on 2016’s $7.98 billion. The company highlighted the performance stemmed from “continued focus on sale effectiveness, improving the penetration into our Investment Banking services, and growing the Unit Trust portfolios, coupled with increases in pension management fees. Additionally, our focus on providing our customers with non-branch channel and digital options has led to volume growth in point of sale and e-commerce transactions”.
The bank also reported a gain on foreign currency and investment activities of $5.62 billion, a growth of 80% relative to $3.13 billion in 2016. Insurance premium income for the period declined 2% to $5.63 billion (2016: $5.73 billion), while dividend income increased 106% to a total of $185.71 million (2016: $90.32 million).
Other Operating Income climbed by 63% to $163.99 million (2016: $100.75 million). Consequently, total operating income increased 16% to a total of $44.22 billion (2016: $38.07 billion). Total operating income for the third quarter recorded a 19% growth to $15.05 billion (2016: $12.68 billion).
Total Operating Expenses for the period amounted to $28 billion, an increase of 9% compared to the $25.69 billion reported for the nine months ended June 30, 2016. Expenses for the quarter rose 18% to close at $8.88 billion compared to $7.55 billion in 2016. According to NCBFG, “we continue our cost optimisation efforts to align costs to strategy and examine expenses across the organization we expect to see each business segment better equipped to deliver on its objectives”.” The increase within the nine months was due to other operating expenses and staff costs expenses. Of these expenses staff costs increased 18% to $12.09 billion relative to $10.21 billion in 2016, while other operating expenses which grew by 11% to $11.04 billion (2016: $9.91 billion).
Provision for credit losses fell 45% to $497.30 million (2016: $903.63 million) while depreciation and amortization grew by 24% to $1.72 billion (2016: $1.38 billion). Policyholders’ and annuitants’ benefits and reserves decreased by 19% to $2.65 billion relative to $3.29 billion for the prior year’s corresponding period.
Consequently, operating profit increased 31% to total $16.21 billion (2016: $12.37 billion). ‘Share of profit of associates’ surged by 471% to total $2.22 billion compared to $389.42 million in 2016. The bank noted, “Share of profit of associates grew by $1.8 billion mainly as a result of the acquisition of the 29.99% shareholding in Guardian Holdings Limited”. Consequently, profit before taxation increased 44% to $18.44 billion relative to $12.76 billion in 2016.
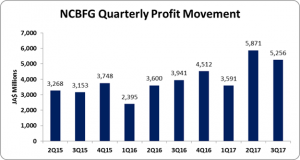
After accounting for taxation of $3.72 billion (2016: $2.83 billion), net profit for the nine months totaled $14.72 billion, an increase of 48% compared to $9.94 billion for the corresponding period of 2016. The company indicated that “Our nine months results signify the highest net profit performance for the Group, exceeding the full year results for the 2016 financial year”. Net profit for the third quarter improved by 33% to close at $5.26 billion (2016: $3.94 billion).
Earnings per share (EPS) for the nine months ended June 30, 2017 totaled $5.97 relative to $4.03 booked for the comparable period of 2016. The EPS for the third quarter amounted to $2.13 (2016: $1.60). The trailing twelve month EPS amounted to $7.80. The number of shares used in our calculations amounted to 2,466,762,828 units.
Balance Sheet at a glance:
Total Assets increased by 16% to $665.01 billion as at June 30, 2017 from $584.80 billion a year ago. This increase stemmed mainly from the growth in ‘Loans & Advances, Net of Provision for Credit Losses’ from $180.08 billion to $212.04 billion, a 18% increase. Other notable contributors to the increase in the asset base was ‘Cash in Hand and Balances at Central Banks’ which rose 55% to $48.84 billion relative to $31.59 billion for the corresponding period in 2016.
Shareholder’s Equity as at June 30, 2017 stood at $111.68 billion relative to $96.52 billion a year ago. This resulted in book value per share of $45.28 (2016: $39.13).