
Jamaica Broilers Group (JBG) for the three months ended July 31, 2017, Revenues totalled $11.49 billion, a 15% increase on the $10.02 billion reported in 2016. Total revenue was broken down as follows;
The Jamaica Operations contributed $7.87 billion, a 9% increase compared to $7.23 billion for the same period of 2016. JBG noted, “Jamaica Operations reported a first quarter segment result of $499 million, which was $192 million of 30% below last year’s normalised segment result of $641 million. This decrease was attributed to lowed production volumes and higher distribution costs when compared to the prior year. These higher costs were as a result of a rebalancing of the inventory in the poultry segment, as well as some third-party storage issues that took place in the first quarter. Total revenue for our Jamaica Operations showed a strong increase of 8%.”
US Operations recorded an increase of 27% to total $3.09 billion relative to $2.43 billion last year. According to the company, “our U.S. Operations continued to grow steadily and reported a segment result of $318 million, which was a 7% increase over the prior year’s result of $297 million. Our presence in this market remains robust with a broad and diverse customer base. Total revenue for this segment increased driven by increased sales of our main products – fertile eggs and baby chicks.”
Other Caribbean Operations contributed $526.77 million, an increase of 47% when compared to $3359.50 million. Management highlighted, “in the Other Caribbean segment, Haiti Broilers SA continues to benefit from the increased production and sale of table eggs which increased to 30% of the market, compared to 22% of the market at the end of the first quarter last year. The segment result for the first quarter amounted to $121 million, which was 64% above the previous year.”
Cost of Sales grew by 20% to $8.82 billion from $7.36 billion in 2016. Gross profit for the first quarter reflected an increase of 1% to close at $2.67 billion versus $2.65 billion booked for the corresponding period in 2016.
Other income climbed 25% from $55.04 million for the first quarter of 2016 to $68.94 million in 2017. Distribution costs rose 38% to close at $443.78 million relative to $321.26 million recorded for the prior year’s comparable period, while administration and other expenses grew by 4% to $1.86 billion (2016: $1.79 billion). According to the company, “distribution costs and administrative costs, reflect an increase of 9% over the previous year due primarily to inflation, exchange rate movements and increased development costs associated with the improvement of the Group’s information systems and IT security. These expenses include one-off cost elements incurred in the quarter which are not expected to recur.”
Operating profit declined by 27%, totalling $436.43 million relative to $660.97 million last year.
JBG reported finance income of $10.44 million (2016: $123.29 million) a decrease of 92%, while finance costs declined by 8% to $150.45 million relative to $163.27 million in 2016.
Profit before taxation decreased for the period amounting to $296.42 million (2016: $560.99 million). Tax charges for the quarter totalled $83.84 million (2016: $159.72 million). As such, net profit amounted to amounted to $212.59 million (2016: $401.27 million).
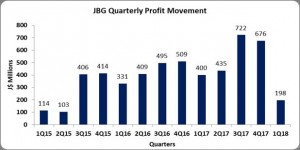
Net profit attributable to shareholders amounted to $197.69 million relative to $400.02 million booking for the comparable period in 2016.
Total comprehensive income for the first quarter amounted to $211.35 million relative to a loss of $459.85 million.
Consequently, earnings per share totaled $0.16 relative to $0.33 booked for the first quarter of 2016. The trailing twelve months EPS amounted to $1.69. The total shares used in our calculation amounted to 1,199,276,400 units.
Balance sheet at a glance:-
Total assets amounted to $27.70 billion as at July 31, 2017 relative to $23.92 billion a year prior. The increase in total assets was due mainly an increase in ‘Biological Assets’ and ‘Cash and Short-term Investments’ which rose 41% and 85% respectively. ‘Biological Assets’ and ‘Cash and Short-term Investments’ as at July 31, 2017 amounted to $4.34 billion (2016: $3.08 billion) and $1.98 billion (216: $1.07 billion) respectively. Inventories also contributed to the growth in the asset base with a 15% or 742.72 million increase from $4.82 billion in 2016 to $5.57 billion.
Shareholders equity amounted to $14.65 billion (2016: $12.70 billion) with a book value per share of $12.22 (2016: $10.59).
The information contained herein has been obtained from sources believed to be reliable, however its accuracy and completeness cannot be guaranteed. You are hereby notified that any disclosure, copying, distribution or taking any action in reliance on the contents of this information is strictly prohibited and may be unlawful. Mayberry may effect transactions or have positions in securities mentioned herein. In addition, employees of Mayberry may have positions and effect transactions in the securities mentioned herein.


