Date: September 5, 2018
Jamaica Broilers Group (JBG) reported total revenues of $12.16 billion, a 6% increase on the $11.49 billion reported in 2017. Total revenue was broken down as follows. Of total revenues:
- The Jamaica Operations contributed $8.24 billion, a 5% increase compared to $7.87 billion for the same period of 2017.
- US Operations recorded an increase of 7% to total $3.32 billion relative to $3.09 billion last year. According to the company, “Our US Operations reported a segment result of $300 million, which was a 6% decrease from the prior year’s result of $318 million. This decrease was primarily attributable to one-off staff cost elements and acquisition costs related to the recent feed mill purchase; these cost elements are not expected to recur. Total revenue for this segment increased by 8% over the prior year driven by increased sales of our main products – fertile eggs and baby chicks.”
- Haiti Operating contributed $594.99 million, an increase of 13% when compared to $526.77 million. Management highlighted, “Haiti Operations has increased their market share of table eggs to 34%, compared to 30% of the market at the end of the first quarter last year. The segment result for the first quarter amounted to $60 million, which is $15 million or 32% above last year’s segment result of $45 million. Total revenue increased by 13%.”
Cost of Sales grew by 2% to $8.98 billion from $8.82 billion in 2017. As such, gross profit for the first quarter reflected an increase of 19% to close at $3.18 billion versus $2.67 billion booked for the corresponding period in 2017.
Other income climbed 179% from $68.94 million for the first quarter of 2017 to $192.56 million in 2017. Distribution costs declined 2% to close at $436.09 million relative to $443.78 million recorded for the prior year’s comparable period, while administration and other expenses grew by 22% to $2.27 billion (2017: $1.86 billion). According to the company, “distribution costs and administrative costs, reflect an increase of 17% over the previous year primarily due to salary increases and exchange movements”
Operating profit increased by 52%, totalling $664.70 million relative to $436.43 million last year.
JBG reported finance income of $300.06 million (2017: $10.44 million) an increase of 2774%, while finance costs increased by 115% to $323.65 million relative to $150.45million in 2017.
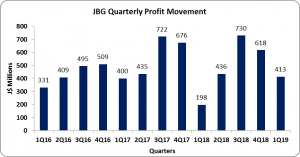
Profit before taxation increased for the period amounting to $641.11 million (2017: $296.42 million). Tax charges for the quarter totalled $227.73 million (2017: $83.84 million). As such, net profit amounted to amounted to $413.38 million (2017: $212.59 million).
Net profit attributable to shareholders amounted to $398.84 million relative to $197.69 million booking for the comparable period in 2017.
Total comprehensive income for the first quarter amounted to $712.74 million relative to $228.60 million.
Consequently, earnings per share totalled $0.33 relative to $0.16 booked for the first quarter of 2017. The trailing twelve months EPS amounted to $1.82. The total shares used in our calculation amounted to 1,199,276,400 units. Notably, JBG closed the trading period on September 5, 2018 at a price of $26.88.
Balance sheet at a glance:-
Total assets amounted to $32.42 billion as at July 31, 2018 relative to $27.70 billion a year prior. The increase in total assets was due mainly an increase in ‘Property, Plant and Equipment’ and ‘Biological assets’ which rose 17% and 32% respectively. ‘Property, Plant and Equipment’ and ‘Biological assets’ as at July 31, 2018 amounted to $8.44 billion (2017: $7.22 billion) and $5.74 billion (2017: $4.35 billion) respectively. ‘Cash and short term investments’ also contributed to the growth in the asset base with a 57% increase from $1.98 billion in 2017 to $3.11 billion.
Shareholders equity amounted to $13.32 billion (2017: $14.65 billion) with a book value per share of $11.06 (2016: $12.22).
Disclaimer:
Analyst Certification -The views expressed in this research report accurately reflect the personal views of Mayberry Investments Limited Research Department about those issuer (s) or securities as at the date of this report. Each research analyst (s) also certify that no part of their compensation was, is, or will be, directly or indirectly, related to the specific recommendation (s) or view (s) expressed by that research analyst in this research report.
Company Disclosure -The information contained herein has been obtained from sources believed to be reliable, however its accuracy and completeness cannot be guaranteed. You are hereby notified that any disclosure, copying, distribution or taking any action in reliance on the contents of this information is strictly prohibited and may be unlawful. Mayberry may effect transactions or have positions in securities mentioned herein. In addition, employees of Mayberry may have positions and effect transactions in the securities mentioned herein.

