Date: March 02, 2020
Kingston Wharves Limited (KW) for the year ended December 31, 2019 reported total revenue of $7.90 billion, a 9% increase relative to the $7.25 billion recorded for the corresponding period in 2018. Revenue for the quarter amounted to $2.18 billion, a 9% growth relative to the $1.99 billion recorded for the same period in 2018. This as both the company’s ‘Terminal Operations’ and ‘Logistics & Ancillary Service’ segments reported increases.
The ‘Terminal Operations’ which accounted for 73% of total revenues, increased 8% year over year to a total of $5.75 billion relative to $5.34 billion last year. According to KW, the “improved performance in this business was attributable to increased motor vehicle shipments and handling services for local and regional markets as well as, strong growth in bulk and break bulk cargo serviced at the port. KWL achieved record motor unit moves in 2019, and benefitted from the establishment of the Global Auto Logistics Centre and expanded improved yard capacity on the KWL main Terminal. The positive performance in motor vehicle, bulk cargo and break-bulk cargo volumes was partially offset by a small reduction in container movement arising from fewer vessel calls during the year from global container carriers.”
The company’s ‘Logistics & Ancillary Services’ grew 12%, to total $2.14 billion, up from $1.91 billion. The company highlighted that, “The division benefits from continued efforts to diversify and grow its customer base as well as its range logistics services. The expansion of KWL’s warehousing operations has boosted the company’s capacity to deliver full-suite logistics services, including inventory management; order picking and packing; order fulfillment; product assembling and labeling, scanning as well as warehousing and returns. The Global Auto Logistics Centre, now fully operational, also enables the company to provide the full range of logistics and inventory management services to the automotive trade.”
Cost of sales rose 3% to a total of $3.85 billion (2018: $3.75 billion). As such, gross profit grew by 16% for the period to total $4.04 billion relative to $3.50 billion recorded a year ago. Gross profit within the fourth quarter rose 11% to close at $1.11 billion compared to $1 billion booked for the quarter ended December 31, 2018.
Other operating income for the period rose year over year to total $262.02 million (2018: $159.52 million). Administrative expenses for the year increased slightly, amounting to $1.203 billion from the $1.199 billion recorded for the same period last year.
As such operating profit closed the year end at $3.10 billion, a 26% increase relative to the $2.46 billion recorded for the comparable period in 2018. For the quarter, operating profit amounted to $787.41 million (2018: $542.92 million).
Gain on acquisition of subsidiary totaled $16.12 million (2018: nil), while gain on disposal of interest in joint venture closed at $22.16 million (2018: nil).
Finance costs for the period fell 18% total $177.92 million relative $217.38 million recorded for the same period in 2018.
Profit before taxation closed the year at $2.96 billion, growing 32% year over year (2018: $2.24 billion).
Income tax expense for the period amounted to $326.14 million for the year end, a 22% increase relative to the $268.05 million incurred for same period last year. Consequently, net profit for the period moved from $1.97 billion in 2018 to $2.64 billion in 2019, a 34% growth year over year.
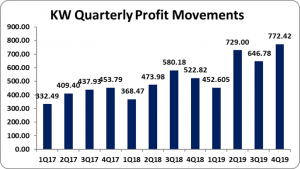
Total comprehensive income for the year end closed at $2.63 billion (2018: $2.50 billion). In addition, net profit attributable to shareholders rose by 34% to total $2.60 billion relative to $1.95 billion recorded for the corresponding period in 2018. Net profits attributable to shareholders for the quarter amounted to $772.42 million, a 49% increase relative to the $522.82 million recorded for the same quarter of 2018.
Consequently, earnings per share for the year ended December 31, 2019 amounted to $1.82 (2018: $1.36), while earnings per share for the quarter amounted $0.54 relative to the $0.37 recorded for same quarter in 2018. The total number of shares used in the calculations amounted to 1,430,199,578 units. Notably, KW’s stock price closed the trading period on February 28, 2020 at a price of $54.35.
Notably, KW stated, “in keeping with our strategic focus and core business model, in 2020, we will continue to develop and modernize our port infrastructure through the rehabilitation of berthing facilities, capital investment in cargo handling equipment and information systems that improve the efficiency and resilience of our operation. We will also continue our program of acquisition and development of modern warehousing and distribution centres that support local and regional industry engaged in imports and exports of goods.
Furthermore, “in 2019 we completed an investment of $100 Million for drainage reconstruction to alleviate flooding in Newport West. During 2020, we will seek to cooperate with other industry participants to improve the traffic flow and to improve the security arrangements in the areas surrounding the port. We take our responsibilities to port community seriously and are determined to sustain our program of continuous improvement,” the Company mentioned.
Balance Sheet Highlights:
As at December 31, 2019, the company’s assets totaled $32.58 billion relative to $31.46 billion a year ago, an increase of 4%, which was driven mainly by an increase in ‘Retirement Benefit Assets’ and ‘Short-term investments’ which increased 4% and 17% respectively to total $2.07 billion (2018: $1.99 billion) and $5.23 billion (2018: $4.46 billion) respectively. Notably, the company also booked $568.62 million for ‘Investment Property’ relative to nil the prior year.
Shareholders’ Equity amounted to $26.59 billion compared to equity of $24.77 billion reported as at December 31, 2018. As such, KW has a book value per share of $18.59 (2018: $17.32).
Analyst Certification -The views expressed in this research report accurately reflect the personal views of Mayberry Investments Limited Research Department about those issuer (s) or securities as at the date of this report. Each research analyst (s) also certify that no part of their compensation was, is, or will be, directly or indirectly, related to the specific recommendation (s) or view (s) expressed by that research analyst in this research report.
Company Disclosure -The information contained herein has been obtained from sources believed to be reliable, however its accuracy and completeness cannot be guaranteed. You are hereby notified that any disclosure, copying, distribution or taking any action in reliance on the contents of this information is strictly prohibited and may be unlawful. Mayberry may effect transactions or have positions in securities mentioned herein. In addition, employees of Mayberry may have positions and effect transactions in the securities mentioned herein.


