November 6, 2019
Lasco Distributors Limited (LASD), for the six months ended September 30, 2019, posted 7% growth revenues to $9.41 billion, up from $8.78 billion in the corresponding period in 2018. For the quarter, revenues increased by 13% closing at $5.07 billion (2018: $4.50 billion).
Cost of sales amounted to $7.51 billion, up 7% on the $7.01 billion reported in the prior comparable period. Within the second quarter, cost of sales went up by 12% to $4.03 billion versus $3.60 billion in the previous quarter in 2018.
Consequently, gross profit recorded an increase of 7% year over year, closing at $1.90 billion compared to the $1.78 billion generated for same period in the prior year. However, gross profit for the quarter climbed by 14% totalling $1.03 billion (2018: $904.25 million).
Other operating income fell by 56% to end the six months period at $45.31 million relative to $103.92 million in the corresponding period last year. For the quarter, other operating loss was $7.35 million versus an operating income of $61.23 million in 2018.
Operating Expenses of $1.50 billion was booked for the six months, a growth of 9% on $1.38 billion recorded for the comparable period of 2018. Operating Expenses went up by 9% for the second quarter amounting to $779.01 million (2018: $716.73 million).
Operating profit fell by 12% to close at $439.82 million for the period under review versus $502.49 million. For the quarter, there was a 1% decline closing at $247.09 million relative to $248.75 million in the prior comparable quarter in 2018.
Finance Cost increased to $10.06 million for the period compared to $323,000 booked in the year prior.
Pre-tax Profits amounted to $429.76 million, a decrease of 14% from the $502.17 million in the previous year. Pre-tax profits saw a 2% decrease in the second quarter closing at $242.69 million (2018: $248.60 million).
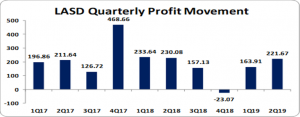
Net Profit for the period closed at $385.58 million (2018: $463.72 million), a 17% decline year over year. As for the second quarter, Net Profit fell 4% to $221.67 million (2018: $230.08 million). LASD noted that, “the six months comparative decline in profit was heavily attributable to restructuring expenses and legal fees associated with ongoing matters including the Pfizer case and investment in our route to market.” Total Comprehensive Income for the first six months totalled $400.84 million (2018: $463.72 million).
Earnings Per Share for the six months ended September 2019 totalled $0.11 versus $0.13 for the corresponding period in 2018. For the quarter, Earnings Per Share amounted to $0.06 (2018: $0.07). The trailing twelve months EPS is $0.15. The total amount of shares outstanding used for this calculation was 3,507,359,835 units. Notably, LASD’s closed the trading period on November 06, 2019, at $3.33.
Management highlighted that, “though net profits are still down versus the prior year, we have arrested much of 30% profit decline we saw in the first quarter, holding true to our plan for diminishing the impact of the one-off expenses incurred in quarter one on future months. We will continue to aggressively drive the business forward to deliver improved profits above that of the prior year in the ensuing quarters. We have secured three additional suppliers for our Pharmaceutical division and expect material gains in performance from the incremental business. The Consumer division through the increased marketing and sales initiatives will continue to expand distribution and market share gains for the business and is poised to launch new products categories and expand our beverage offerings in line with emerging consumer tastes to continue the explosion of growth of our liquid business. These exciting new introductions will deliver incremental sales to the business as well as add to the diversity of the already exciting LASCO stable of affordable high-quality products.”
Balance sheet at a glance:
As at September 30,2019, ‘Total Assets’ amounted to $9.27 billion, 5% more than last year’s $8.87 billion. ‘Total Non-Current Assets’ totalled $2.09 billion (2018: $1.74 billion), a 20% increase over the corresponding period last year. The movement year over year was due to ‘Property, Plant and Equipment’ which closed at $1.90 billion, rising by 18% over the previous year. ‘Receivables’ and ‘Related Companies’ also contributed to this increase in total assets with a 4% and 128% growth respectively to close at $2.86 billion (2018: $2.75 billion) and $255.96 million (2018: $112.14 million), respectively.
Shareholders equity amounted to $5.44 billion as at September 30, 2019 (2018: $5.04 billion), reflecting an increase of 8%. This translated in book value per share of $1.55(2018: $1.44).
Analyst Certification -This research report is for information purposes only and should not be construed as a recommendation. Each research analyst (s) also certify that no part of their compensation was, is, or will be, directly or indirectly, related to the specific recommendation (s) or view (s) expressed by that research analyst in this research report.
Company Disclosure -The information contained herein has been obtained from sources believed to be reliable, however its accuracy and completeness cannot be guaranteed. You are hereby notified that any disclosure, copying, distribution or taking any action in reliance on the contents of this information is strictly prohibited and may be unlawful. Mayberry may effect transactions or have positions in securities mentioned herein. In addition, employees of Mayberry may have positions and effect transactions in the securities mentioned herein.


