
April 27, 2018
NCB Financial Group (NCBJ) for the six months ended March 31, 2018 reported Net Interest Income increased by 8.66%, relative to the corresponding period in 2017, to total $15.91 billion (2017: $14.64 billion). The Company noted this was “driven by the consolidation of our newest subsidiary, Clarien Group Limited (CGL).” For the quarter, Net Interest Income improved 12.41% to close at $8.36 billion (2017: $7.43 billion). Interest income rose 16.81% year over year for the six months to $24.28 billion compared to $20.78 billion in 2017, while interest expense amounted to $8.37 billion relative to $6.15 billion for the corresponding period in 2017.
Net Fees and Commission Income amounted to $7.72 billion, an increase of 10.76% versus 2016’s $6.97 billion. The company highlighted the performance was, “mainly as a result of higher transaction volumes for point of sale and e-commerce channels, increased investment banking and pension fee income and the consolidation of CGL”. The bank also reported a gain on foreign currency and investment activities of $7.17 billion, a growth of 96.92% relative to $3.64 billion in 2017. Premium income for the period also increased 15.97% to $4.31 billion (2017: $3.72 billion), while dividend income increased 95.91% to a total of $207.37 million (2017: $105.85 million).
Other Operating Income climbed by 332.57% to $422.44 million (2017: $97.66 million). Consequently, total operating income increased 22.51% to a total of $35.73 billion (2017: $29.17 billion). Total operating income for the second quarter recorded a 27.37% growth to $19.04 billion (2017: $14.95 billion).
Total Operating Expenses for the period amounted to $24.91 billion, an increase of 30.27% compared to the $19.12 billion reported for the first six months of 2017. Expenses for the quarter rose 30.42% to close at $11.75 billion compared to $9.01 billion in 2017. According to NCBFG, “Our expenses continue to be impacted by the on-going retooling and business model transformation.” Of these expenses:
- Staff costs increased 37.97% to $11.12 billion relative to $8.06 billion in 2017
- Policy holders and annuitants benefits and reverses increased 102.82% to total $3.23 billion (2017:$1.59 billion)
- Other operating expenses grew by 7.05% to $8.59 billion (2017: $8.02 billion).
- Provision for credit loss increased from $347.35 million in 2017 to close at $432.48 million in 2018.
- Depreciation and amortization grew 39.95% to $1.54 billion relative to the $1.10 billion recorded in 2017.
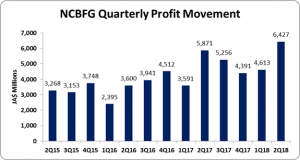
Consequently, operating profit increased 7.74% to total $10.82 billion (2017: $10.05 billion). ‘Share of profit of associates’ declined 10.02% to total $1.48 billion compared to $1.64 billion in 2017. The bank also reported a ‘Negative goodwill on acquisition of subsidiary’ of $1.47 billion. Consequently, profit before taxation increased 17.79% to $13.77 billion relative to $11.69 billion in 2017. Following taxation of $2.73 billion (2016: $2.23 billion), net profit for the six months ended March 31, 2018 totaled $11.04 billion, an increase of 16.69% compared to $9.46 billion for the corresponding period of 2017. Net profit for the second quarter improved by 9.48% to close at $6.43 billion (2017: $5.87 billion).
Earnings per share (EPS) for the six months ended March 31, 2018 totaled $4.48 relative to $3.84 booked for the comparable period of 2017. The EPS for the second quarter amounted to $2.61 (2017: $2.38). The trailing twelve month EPS amounted to $8.39. The number of shares used in our calculations amounted to 2,466,762,828 units. NCBFG stock price closed the trading period at a price of $95.07 on April 26, 2018.
NCBFG noted, “During the period, we advanced our digital transformation recognising the need to provide enhanced solutions to improve the customer experience. A critical component of our strategy continues to be reinventing our core business for continuous improvement. These improvements coupled with our digital offerings will advance our aspiration to become NCB 2.0: Faster | Simpler | Stronger.”
Balance Sheet at a glance:
Total Assets increased by 39.35% or $251.50 billion to $890.66 billion as at March 31, 2018 from $639.17 billion a year ago. This increase stemmed mainly from the growth in ‘Loans & Advances, Net of Provision for Credit Losses’ from $207.29 billion to $334.30 billion, a 61.27% increase. The Bank noted, “In addition to the consolidation of CGL, there was growth in all our business segments’ loan portfolios: retail up 22%, corporate up 11% and credit card receivables up 25%.” Other notable contributors to the increase in the asset base was ‘Pledged Assets and ‘Investment securities’ which rose 29.44% and 12.59% respectively to $134.63 billion and $219.92 billion respectively.
Shareholder’s Equity as at March 31, 2018 stood at $124.95 billion relative to $106.41 billion a year ago. This resulted in book value per share of $50.65 (2017: $43.14).
The information contained herein has been obtained from sources believed to be reliable, however its accuracy and completeness cannot be guaranteed. You are hereby notified that any disclosure, copying, distribution or taking any action in reliance on the contents of this information is strictly prohibited and may be unlawful. Mayberry may effect transactions or have positions in securities mentioned herein. In addition, employees of Mayberry may have positions and effect transactions in the securities mentioned herein.


