February 3, 2023
For three months ended December 31, 2022, NCB Financial Group Limited (NCBFG) net interest income increased by 5%, relative to 2021, to total $17.04 billion (2021: $16.28 billion). Interest income for the first three months closed at $25.85 billion, 17% above the $22.11 billion reported corresponding period ended December 31, 2021. Interest expense year over year rose 51% to close at $8.81 billion (2021: $5.83 billion).
Net fees and commission income amounted to $7.00 billion, a 9% increase when compared to 2021’s $6.43 billion. Of this, ‘Fee and commission income’ totalled $9.46 billon (2021: $8.39 billion), while ‘Fee and commission expense’ amounted to $2.46 billion (2021: $1.96 billion). Dividend income decreased by 10% to a total of $849.34 million (2021: $944.25 million). Other Operating Income increased 41% to $1.80 billion (2021: $1.27 billion). Credit impairment losses fell marginally by 0.4% to $1.83 billion. Lastly, the Company’s Gain on foreign currency and investment activities rose 32% to $2.14 billion compared to $1.62 billion reported in 2021.
Net revenues from insurance activities, for the three months ended December 31, 2022, declined 71% to $2.66 billion (2021: $9.30 billion). NCBFG noted that this was attributable to, “a one-off actuarial adjustment of approximately $3.5 billion combined with additional reserve movements from our periodic assumption updates”. Of this, Insurance premium income fell 2% to $41.64 billion (2021: $42.37 billion), while reinsurance commission income declined 1% to $2.82 billion (2021: $2.85 billion). Insurance premium ceded to insurers amounted to $14.33 billion (2021: $13.14 billion). Commission and other selling expenses rose to $5.27 billion compared to $4.57 billion in 2021. Net underwriting income declined 6% to close at $30.13 billion (2021: $32.08 billion).
As such, net operating income amounted to $29.65 billion for the three months ended December 31, 2022 compared to $34.01 billion booked the prior corresponding period.
Total Operating Expenses for the first quarter amounted to $26.28 billion, a decrease of 3% compared to the $26.97 billion reported for the three months ended December 31, 2021. According to Management, “there were lower credit card rebate expenses, professional fees and consultancy charges, we will continue to pursue cost optimization initiatives while continuing our digital investments as focus on enhancing the customer experience and improving efficiency.” The expenses are as follows:
-
- Staff costs increased 9% to $13.03 billion relative to $11.93 billion in 2021.
- Other operating expenses fell by 6% to $11.47 billion (2021: $12.14 billion).
- Depreciation and amortization fell by 50% to $1.22 billion (2021: $2.44 billion).
- Finance cost grew 22% to $566.98 million (2021: $463.07 million).
Consequently, operating profit decreased 52% to total $3.37 billion (2021: $7.04 billion).
‘Share of loss of associate’ amounted to $9.12 million compared to a profit of $289.06 million reported in 2021. Consequently, profit before taxation decreased 54% to $3.36 billion relative to $7.33 billion in 2021. Following taxation of $2.01 billion (2021: $1.95 billion), the net profit for the three months ended December 31, 2022 totalled $1.35 billion, a 75% decrease compared to $5.38 billion for the corresponding period of 2021.
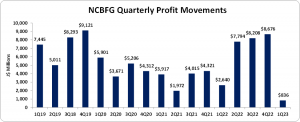
Net profit attributable to shareholders for the quarter ended December 31, 2022 closed at $835.79 million relative to $2.64 billion in 2021.
Earnings per share (EPS) for the three months period totalled $0.34 relative to $1.07 booked in 2021. The trailing twelve-month EPS amounted to $10.34. The number of shares used in our calculations amounted to 2,466,762,828 units. NCBFG stock price closed the trading period at a price of $80.00 on February 2, 2023 with a corresponding P/E ratio of 7.73 times.
Balance Sheet at a glance:
Total Assets increased by 4% to $2.11 trillion as at December 31, 2022 from $2.03 trillion a year ago. This increase in the asset base was mainly due to a $43.47 billion increase in ‘Loans and Advances, Net of Provision for Credit Losses’ which moved from $549.54 billion in 2021 to $593.01 billion in 2022. This was mainly tempered by a 73% decrease in ‘Income Tax Recoverable’ which moved from $8.07 billion in 2021 to $2.15 billion in 2022.
Shareholders’ Equity as at December 31, 2022 closed at $172.22 billion relative to $163.88 billion a year ago. This resulted in a book value per share of $69.82 (2021: $66.43).
Disclaimer:
Analyst Certification -The views expressed in this research report accurately reflect the personal views of Mayberry Investments Limited Research Department about those issuer (s) or securities as at the date of this report. Each research analyst (s) also certify that no part of their compensation was, is, or will be, directly or indirectly, related to the specific recommendation (s) or view (s) expressed by that research analyst in this research report.
Company Disclosure -The information contained herein has been obtained from sources believed to be reliable, however its accuracy and completeness cannot be guaranteed. You are hereby notified that any disclosure, copying, distribution or taking any action in reliance on the contents of this information is strictly prohibited and may be unlawful. Mayberry may affect transactions or have positions in securities mentioned herein. In addition, employees of Mayberry may have positions and effect transactions in the securities mentioned herein.


