
February 3, 2023
US Unemployment rate decreases to 3.4% in January 2023, Non-Farm Payrolls rose by 517,000 vs 185,000 estimate
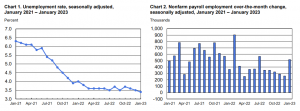
According to today’s report from the U.S. Bureau of Labor Statistics, nonfarm payroll employment increased overall by 517,000 in January while the unemployment rate decreased marginally to 3.4 percent. Gains in leisure and hospitality, professional and business services, and health care were the industries that saw the most job growth overall. Government employment increased as well, in part due to the workers’ return from a strike.
Household Survey Data
In January, there was little change in either the unemployment rate or the total number of unemployed people, both of which were 5.7 million. Since early 2022, there hasn’t been much of a net change in the unemployment rate.
Adult men (3.2%), adult women (3.1%), teens (10.3%), Whites (3.1%), Blacks (5.4%), Asians (2.8%), and Hispanics (4.5%) were the key worker categories with the lowest unemployment rates in January. There were 1.9 million fewer people unemployed for less five weeks. Long-term unemployment, defined as being out of work for 27 weeks or longer, remained at 1.1 million, largely unchanged. In January, 19.4% of all unemployed people were long-term jobless.
After accounting for the effects of the annual modifications to the population controls, both the employment-population ratio (60.2%) and the labor force participation rate (62.4%) in January remained constant. These metrics haven’t changed much since the beginning of 2022 and are still below their pre-pandemic values from February 2020. (63.3 percent and 61.1 percent, respectively).
At 4.1 million, the number of people working part-time for economic reasons did not significantly change in January. Due to their reduced hours or inability to acquire full-time employment, these people, who preferred full-time employment, were working part-time jobs.
In January, there were 5.3 million people who are currently looking for work but are not actively participating in the labor force. Due to their inactivity or inability to accept a job offer during the four weeks before to the poll, these people were not counted as unemployed.
The number of people who were marginally tied to the labor force, at 1.4 million, did not change much in January among those who wanted a job but were not currently in it. These people desired a job, were available to work, and had sought for one at some point in the previous 12 months, but they hadn’t done so in the four weeks before the poll. At 342,000, the number of discouraged workers—a subset of the marginally attached who thought there were no jobs available for them throughout the course of the month similarly showed little change.
Establishment Survey Data
Compared to a monthly increase of 401,000 in 2022, the total nonfarm payroll employment increased by 517,000 in January. Gains in leisure and hospitality, professional and business services, and health care were the industries that saw the most job growth in January. Government employment increased as well, in part due to the workers’ return from a strike. In contrast to the 89,000 jobs added each month in 2022, the leisure and hospitality industries added 128,000 positions in January. While employment in the accommodation sector continued to increase (+15,000), 99,000 positions were added in the food services and drinking establishments over the course of the month. By 495,000, or 2.9 percent, the number of people employed in the leisure and hospitality industries is still below its pre-pandemic level in February 2020.
Professional, scientific, and technical services saw the largest increase in employment (82,000), followed by business and professional services (+41,000). In 2022, professional and business services saw an average monthly job gain of 63,000. In January, there were 74,000 more people working for the government. Because of the return of university employees following a strike, employment in state government education surged by 35,000.
The health care sector gained 58,000 positions. Ambulatory health care services (+30,000), nursing homes and residential care facilities (+17,000), and hospitals (+11,000) all had job increase. Health care will add 47,000 jobs per month on average in 2022.
Following a year of modest net growth (an average of +7,000 per month) in 2022, retail employment increased by 30,000 in January. A decrease in health and personal care shops countered some of the employment growth in general merchandise retailers (+16,000) and furniture, home furnishings, electronics, and appliance retailers (+7,000) in January (-6,000).
The construction industry generated 25,000 jobs, primarily due to an increase in specialist trade contractors’ employment (+12,000). In 2022, the construction sector added 22,000 jobs each month on average. Similar to the industry’s average monthly rise in 2022, transportation and warehousing created 23,000 jobs. Transportation support activity employment climbed by 7,000 over the course of the month.
Social assistance employment climbed by 21,000 in January, about in line with the average gain of 19,000 jobs each month predicted through 2022.
In January (+19,000), the employment in manufacturing remained on the rise. Manufacturing will increase employment by 33,000 jobs monthly on average in 2022. Other significant industries, such as mining, quarrying, and oil and gas production; wholesale trade; information; financial activities; and other services; exhibited minimal change in employment over the course of the month.
The average hourly wage for all workers on private nonfarm payrolls increased by 10 cents, or 0.3%, to $33.03 in January. Average hourly wages have climbed by 4.4 percent during the previous 12 months. Average hourly pay for production and nonsupervisory workers in the private sector increased by 7 cents (0.2%) in January to $28.26.
For all employees on private nonfarm payrolls, the typical workweek increased by 0.3 hours to 34.7 hours in January. The average workweek in manufacturing went up by 0.4 hours to 40.5 hours, and overtime went up by 0.1 hours to 3.1 hours. For production and nonsupervisory workers on private nonfarm payrolls, the typical workweek grew by 0.2 hours to 34.1 hours.
Disclaimer:
Analyst Certification -The views expressed in this research report accurately reflect the personal views of Mayberry Investments Limited Research Department about those issuer (s) or securities as at the date of this report. Each research analyst (s) also certify that no part of their compensation was, is, or will be, directly or indirectly, related to the specific recommendation(s) or view (s) expressed by that research analyst in this research report.
Company Disclosure -The information contained herein has been obtained from sources believed to be reliable, however its accuracy and completeness cannot be guaranteed. You are hereby notified that any disclosure, copying, distribution or taking any action in reliance on the contents of this information is strictly prohibited and may be unlawful. Mayberry may affect transactions or have positions in securities mentioned herein. In addition, employees of Mayberry may have positions and effect transactions in the securities mentioned herein.


