The Palace Amusement Company (1921) Limited Revenue for the nine months rose 5% to $691.08 million (2016: $659.91 million), while for the third quarter, an increase of 19% was observed. As such, for the quarter revenue rose to $247.34 million relative to $208.82 million in 2016. Direct Expenses for the period inched up decreased by 6% to $562.12 million (2015: $530.25 million).
As a result, Gross Profit declined by 1% to $128.96 million (2016: $129.67 million). the gross profit for the quarter totalled $51.96 million from $44.44 million, following a 19% growth in Direct Expenses year over year.
Other Operating Income declined to $5.93 million (2016: $7.42), a 20% decline, while Administrative Expenses increased 3% to $129 million (2016: $125.61 million). Consequently, Operating Profit for the period fell significantly to $5.89 million relative to the $11.47 million reported for the corresponding period in 2016.
Interest Expense decreased to $958,000, a 40% reduction compared to $1.58 million recorded in 2016. Net Profit for the period was 50% below than the prior year’s corresponding period, totalling $4.93 million (2016: $9.89 million). Palace Amusement Company Limited booked Net Profit in the sum of $13.15 million (2016: $5.36 million).
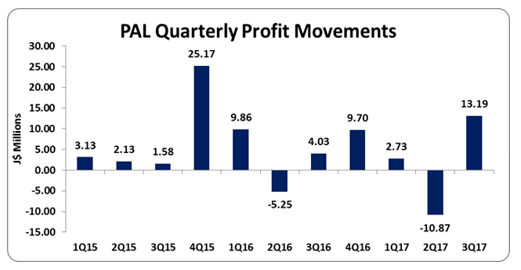
Profits attributable to Stockholder’s of the Company amounted to $5.05 million for the period relative to $9.98 million in 2016. For the quarter, Profit attributable to Stockholder’s closed at $13.19 million relative to $5.37 million for the quarter ended March 2016.
As such, the earnings-per-share (EPS) for the period amounted to $3.51 relative to $6.95 last year, while for the quarter the EPS totalled $9.18 compared to $3.73. The twelve month earnings-per-share amounted to $10.25. The amount of shares used in our calculation is 1,437,028.
Balance Sheet Highlights:
The company, as at March 31, 2017, recorded Total Assets of $44.85 million, a decline of 1% when compared to $444.63 million recorded last year.
Total Stockholders’ Equity as at March 31, 2017 closed at $319.59 million, compared to $307.92 million for the corresponding period last year. This resulted in a book value of $221.00 per share compared to $214.27 as at March 31, 2016.
Disclaimer:
Analyst Certification -This research report is for information purposes only and should not be construed as a recommendation. Each research analyst (s) also certify that no part of their compensation was, is, or will be, directly or indirectly, related to the specific recommendation (s) or view (s) expressed by that research analyst in this research report.
Company Disclosure -The information contained herein has been obtained from sources believed to be reliable, however its accuracy and completeness cannot be guaranteed. You are hereby notified that any disclosure, copying, distribution or taking any action in reliance on the contents of this information is strictly prohibited and may be unlawful. Mayberry may effect transactions or have positions in securities mentioned herein. In addition, employees of Mayberry may have positions and effect transactions in the securities mentioned herein.