
PANJAM Investment Limited (PJAM) for nine months ended September 30, 2017 reported a 22% increase in total income from $1.30 billion relative to $1.59 billion booked for the prior year’s corresponding period. For the quarter total income increased 57% to $643.48 million (2016: $409.90 million). According to PJAM, “the year to date growth was due mainly to a 22% increase property income from $918.17 million to $1.12 billion which was, higher rental income resulted from more space leased on average as well as contractual rate increases; revaluation gains benefited from improving occupancy; and net lease income (i.e. expense reimbursement) was driven higher mainly by increased utility costs.” Of total income:
- Other income slid 1% or $1.35 million from $105.87 million to $104.52 million. The company highlighted this was, “driven by collection of amounts previously written off, but is flat for the year to date because of non-recurrence of one-off fee income.”
- Investments rose 38% to close at $331.58 million (2016: $239.75 million). According to PJAM this was attributed to, “the improvement mainly reflects higher dividend income, realized and unrealized gains, while last year’s results were depressed by certain impairment charges.”
- Income from commissions amounted to $37.21 million a 5% decline compared to the $39.12 reported in the 2016.
Operating expenses amounted to $1.05 billion for the nine months ended September 30, 2017 (2016: $933.86 million), 12% more than its total a year prior. Operating expenses for the quarter increased 10% to close at $352.61 million (2016: $321.59 million).
Consequently, operating Profits increased by 47% to a total of $542.92 million relative to $369.02 million a year earlier, while for the quarter operating profit increased 229% to $290.87 million (2016: $88.31 million).
Finance costs for the period rose by 14%, amounting to $441.18 million compared to the $388.02 million for the comparable period in 2016.
Share of results of associated companies rose 22% to $2.97 billion relative to $2.43 billion reported in the previous year. PJAM noted, “this includes the nine-month total share of earnings from Sagicor of $2,839 million, 23% higher than the prior year figure of $2,307 million. Sagicor’s improved results reflect strong performances in employee benefits and individual insurance lines as well as reserve releases now effected on a quarterly basis. New Castle, Caribe and Chukka all performed satisfactorily during the period.”
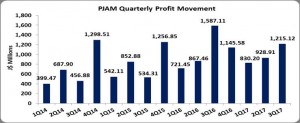
Profit before taxation decreased 6% closing the period at $3.07 billion (2016: $3.26 billion). This was due to a gain on disposal of an associated company of $851.08 million recorded in 2016. Following taxation of $54.97 million (2016: $51.66 million), Net Profits amounted to $3.01 billion (2016: $3.21 billion). Net profit for the quarter amounted to $1.23 billion compared to $1.59 billion booked in 2016.
Net Profit Attributable to Shareholders for the period amounted to $2.97 billion, a 2% increase over the $2.91 billion recorded the year prior. For the third quarter, profit attributable to shareholders amounted to $1.22 billion relative to $1.32 billion.
Consequently, earnings per share for the period amounted to $2.79 (2016: $2.73), while the third quarter amounted to $1.14 (2016: $1.23). The trailing twelve months earnings per share was $3.86. The number of shares used in the calculation is 1,066,159,890 units.
Balance Sheet at a glance:
As at September 30, 2017, PANJAM Investment Limited (PJAM) had assets totaling $36.36 billion, a 13% increase relative to $32.29 billion a year prior. The growth was attributed to an increase in investment in associated companies and securities purchased under agreements to resell which amounted to $23.52 billion (2016: $20.89 billion) and $878.82 billion (2016: $147.86 billion) respectively.
Shareholders Equity amounted to $28.69 billion (2016: $25.77 billion) with a book value per share of $26.91 (2016: $24.17).
Disclaimer:
Analyst Certification -The views expressed in this research report accurately reflect the personal views of Mayberry Investments Limited Research Department about those issuer (s) or securities as at the date of this report. Each research analyst (s) also certify that no part of their compensation was, is, or will be, directly or indirectly, related to the specific recommendation (s) or view (s) expressed by that research analyst in this research report.
Company Disclosure -The information contained herein has been obtained from sources believed to be reliable, however its accuracy and completeness cannot be guaranteed. You are hereby notified that any disclosure, copying, distribution or taking any action in reliance on the contents of this information is strictly prohibited and may be unlawful. Mayberry may effect transactions or have positions in securities mentioned herein. In addition, employees of Mayberry may have positions and effect transactions in the securities mentioned herein.


