
November 15, 2021
PANJAM Investment Limited (PJAM) for nine months ended September 30, 2021 reported a 234% increase in total income to $2.89 billion relative to $863.77 million booked for the prior year’s corresponding period. For the quarter, total income increased 31% to close at $694.25 million (2020: $528.03 million). Of total income:
-
- Investment income amounted to $1.28 billion relative to a loss of $1.15 billion in 2020. According to PJAM, “Investment income improved in line with a modest recovery in local equities and continued strength in overseas equity prices, as well as unrealised gains on certain unquoted investments.”
- Property income fell 5% to $1.51 billion compared to $1.61 billion twelve months earlier, “as a result of lower revaluation gains,” as per PJAM.
- Other income fell 76% from $409.90 million in 2020 to $99.03 million for the nine months ended September 30, 2021.
Operating expenses amounted to $1.33 billion for the nine months ended September 30, 2021 (2020: $1.24 billion), 7% more than its total a year prior, as “as the Company reinstated typical administrative expenditure in line with the measured return to normalcy,” according to the Company. Operating expenses for the quarter increased at 11% to close at $458.02 million (2020: $414.25 million).
Impairment losses for the nine months amounted to $11.88 million (2020: $68.28 million).
Consequently, operating profit amounted to $1.55 billion relative to an operating loss of $443.24 million in 2020, while for the quarter, operating profit rose 179% to $206.72 million (2020: $74.08 million).
Finance costs for the period rose by 13%, amounting to $688.08 million compared to the $606.87 million for the comparable period in 2020.
Gain on Disposal of associated Company amounted was $25.53 million relative to nil in 2020, while the share of results of associated companies increased 41% to $4.07 billion (2020: $2.87 billion). PJAM noted that this was as a “result of strong performances from Sagicor, New Castle Company Limited and Outsourcing Management Limited.”
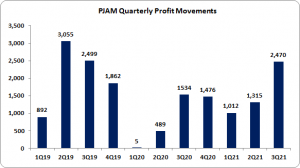
Profit before taxation increased 172% closing the period at $4.95 billion (2020: $1.82 billion). Following taxation charge of $138.81 million relative to a taxation credit of $228.47 million in 2020, Net profit amounted to $4.81 billion (2020: $2.05 billion). Net profit for the quarter amounted to $2.47 billion relative to $1.54 billion for the corresponding quarter of 2020.
Net Profit Attributable to Shareholders for the period amounted to $4.80 billion, a 137% increase relative to the $2.03 billion recorded the year prior. For the third quarter, profit attributable to shareholders amounted to $2.47 billion relative to $1.53 billion.
Total Comprehensive Income for the nine months amounted to $4.06 billion (2020: $2.37 billion). For the third quarter, Total Comprehensive Income was $2.23 billion (2020: $2.07 billion).
Consequently, earnings per share for the period amounted to $4.50 (2020: $1.90), while the third quarter EPS amounted to $2.32 (2020: $1.44). The trailing twelve months earnings per share was $5.88. The number of shares used in the calculation is 1,066,159,890 units. PJAM’s stock last traded on November 12, 2021 at $66.65 with a corresponding P/E of 11.33 times.
“Looking ahead, we expect moderate uncertainty to continue. However, we are moving forward with our development plans in for the ROK Hotel & Residences in Downtown Kingston and remain committed to making additional investments in attractive, well-managed local and regional businesses,” as per Management.
Balance Sheet at a glance:
As at September 30, 2021, PJAM had assets totaling $66.39 billion, relative to $60.25 billion a year prior. The growth was attributed to an increase in Investment in associated companies of $37.84 billion (2020: $33.84 billion).
Shareholders Equity amounted to $50.73 billion (2020: $44.78 billion) with a book value per share of $47.58 (2020: $42.00).
Disclaimer:
Analyst Certification -The views expressed in this research report accurately reflect the personal views of Mayberry Investments Limited Research Department about those issuer (s) or securities as at the date of this report. Each research analyst (s) also certify that no part of their compensation was, is, or will be, directly or indirectly, related to the specific recommendation(s) or view (s) expressed by that research analyst in this research report.
Company Disclosure -The information contained herein has been obtained from sources believed to be reliable, however its accuracy and completeness cannot be guaranteed. You are hereby notified that any disclosure, copying, distribution or taking any action in reliance on the contents of this information is strictly prohibited and may be unlawful. Mayberry may effect transactions or have positions in securities mentioned herein. In addition, employees of Mayberry may have positions and effect transactions in the securities mentioned herein.


