
Date: August 09, 2018
Seprod Limited (SEP), for the six months ended June 30, 2018, generated revenue of $10.44 billion compared to the $8.37 billion recorded for the same period of the prior financial year; this represents a 25% increase year over year. The manufacturing division, recorded a 32% growth to close at $9.92 billion. While, the distribution division recorded a 6% decline to close at $3.47 (2017: $3.69). For the quarter, revenue climbed 33% to total $5.48 billion relative to the $4.11 billion reported the prior year’s corresponding quarter.
SEP noted, “The 2018 results are bolstered by the transfer of the former Jamaican dairy operations of Nestle within the Group effective 1 January 2018. These operations, located in Bog Walk, St. Catherine, produce the Supligen and Betty products, as well as co-manufacture products for international customers. In 2017, these operations were operated by Seprod under a management services contract and were not included in the Group’s results.”
Cost of Sales increased by 11% from $6.31 billion to $7 billion, resulting in Gross Profit increasing by 68% to close at $3.44 billion (2017: $2.05 billion).
Finance and Other Operating Income totalled $229.14 million relative to $384.55 million in 2017, a 40% decrease year over year.
Selling expenses decreased by 35% to close the six month period of 2018 at $236.41 million (2017: $360.99 million). However, Administrative Expenses for the period climbed by 85% to total $2.28 billion relative to $1.23 billion.
As such Operating Profit grew 36%, moving from $847.30 million for the second quarter of 2017 to a total of $1.15 billion for comparable period in 2018.
Finance Costs totalled $309.31 million (2017: $170.02 million); an increase of 82% year over year. Share of Results of Joint Venture recorded a gain of $14.58 million compared to a loss of $41.43 million; this led to Profit before taxation increasing to $859.98 million in comparison to $635.85 million reported last year. Profit before Taxation for the second quarter amounted to $459.04 million (2017: $266.88).
The company reported Net Profit of $598.40 million, a growth of 30% relative to last year’s corresponding period of $461.84 million, after incurring taxes of $261.59 million (2017: $174.01 million). For the quarter, Net Profit increased by 71% to $305.50 million compared to $178.88 in 2017.
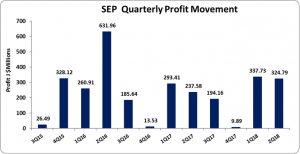
Net Profits attributable to shareholders amounted to $662.52 million, an improvement year on year from the $531 million recorded a year earlier. For the second quarter, Net Profit attributable to shareholders totalled $324.79 million (2017: $237.58 million).
Consequently, Earnings Per Share (EPS) for the six months ended June 30, 2018 amounted to $1.28 relative to $1.03 for the corresponding period in 2017. The Earnings per share for the quarter was reported at $0.63 relative to $0.46 reported in 2017. The twelve months trailing EPS is $1.68. SEP last traded on August 08, 2018 at $33.01.
Management reported that, “the Group would have had much better results had it not been for the J$220 million loss in the sugar operation for the period. Management has exhausted almost all options to make these operations achieve even a breakeven status and we are committed to, in very short order, eliminating these nine years of erosion in shareholders’ value.”
Management further added, “The major focus for the remainder of the year will be to improve employee engagement, to maximize synergies in the dairy operations and to complete the acquisition of Facey Consumer division.”
Balance sheet at a Glance:
As at June 30, 2018, the company’s total assets increased by 14% to $20.61 billion from $18.08 billion a year ago. The increase in assets was largely due an improvement in Intangible Assets amounting to $1.09 billion (2017: $423,000) and Inventories which climbed 49% to close at $3.26 billion (2017: $2.19 billion).
Shareholder equity for the period was $10.56 billion relative to $10.30 billion last year a 3% increase. This resulted in a book value per share of $18.62 relative to $18.69 as at June 30, 2017.
Disclaimer:
Analyst Certification -This research report is for information purposes only and should not be construed as a recommendation. Each research analyst (s) also certify that no part of their compensation was, is, or will be, directly or indirectly, related to the specific recommendation (s) or view (s) expressed by that research analyst in this research report.
Company Disclosure -The information contained herein has been obtained from sources believed to be reliable, however its accuracy and completeness cannot be guaranteed. You are hereby notified that any disclosure, copying, distribution or taking any action in reliance on the contents of this information is strictly prohibited and may be unlawful. Mayberry may affect transactions or have positions in securities mentioned herein. In addition, employees of Mayberry may have positions and effect transactions in the securities mentioned herein.


