
July 24, 2020
Seprod Limited (SEP), for the six months ended June 30, 2020, revenue totalled $18.61 billion compared to the $16.60 billion recorded for the same period of the prior financial year; this represents a 12% increase year over year. Revenue for the quarter totalled $9.47 billion an 18% increase relative to $8.01 billion the prior year.
Cost of Sales rose 14% from $10.62 billion in 2019 to $12.10 billion for the six months ended June 30, 2020. Consequently, gross profit increased 9% to close at $6.51 billion (2019: $5.98 billion), while the second quarter gross profit amounted to $3.76 billion (2019: $3.70 billion).
However, other operating income for the period totalled $217.33 million relative to $324.06 million in 2019, a 33% decline year over year while other operating expenses decreased by 3% to close the six months period at $4.61 billion (2019: $4.74 billion).
Consequently, operating profit increased by 36% to $2.12 billion (2019: $1.56 billion) for the six months ended June 2020. While for the quarter, operating profit increased by 41% to $1.02 billion (2019: $723.48 million).
Finance costs totalled $595.22 million (2019: $552.05 million), an increase of 8% when compared to the same period last year. The company reported share of results of Joint Venture amounting to $4.97 million relative to $54.54 million reported in 2019.
As a result, pre-tax profits rose 45% to $1.53 billion in comparison to profit of $1.06 billion booked in the same period last year. However, for the quarter, pre-tax profit amounted to $677.95 million relative to $494.79 million booked in 2019.
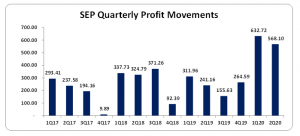
Taxation of $316.05 million was reported for the six months period relative to $198.36 million booked in 2019. Consequently, SEP, for the period under review, booked net profit from continuing operation of $1.22 billion (2019: $862.44 million) and net loss from discontinued operations closed at $16.13 million (2019: $309.33 million). As a result, overall net profit was $1.20 billion (2019: $553.12 million) for the period under review, while for the quarter, net profit closed at $568.10 million (2019: $241.16 million). SEP noted, “the increase in profits from continuing operations was due largely to efforts made in prior years to strengthen the business fundamentals. These efforts included consolidating the dairy factories, increasing exports and expanding the distribution footprint through the acquisition of the Facey Consumer Business.”
The comprehensive income for the six months amounted to $1.30 billion (2019: $594.07 million.) For the second quarter, comprehensive income amounted to $643.85 million (2019: $313.14 million). The company reported total comprehensive income attributable to shareholders of $1.30 billion (2019: $688.17 million). For the quarter attributable to shareholders totalled $643.85 million relative to the $364.60 million reported in 2019.
Earnings per share for the six months ended June 30, 2020 amounted to $1.64 relative to $0.75 for the corresponding period in 2019. The EPS for the quarter was reported at $0.77 relative to $0.33 reported in 2019. The twelve months trailing EPS is $2.21. The number of shares used in our calculations is 733,546,855. SEP closed the trading period on July 23, 2020 at $51.95.
Management noted that, “the company has sought to position itself for continued resilience in the face of the uncertainty that faces us all by tight management of its cashflow. The cash generation and conservation will continue in Q3 with the disposal of certain non-operational assets.”
Balance Sheet at a Glance:
As at June 30, 2020, the company’s total assets increased by 1% to $36.45 billion from $36.06 billion a year ago. The upward movement was greatly tempered by a decrease of $2.35 billion in ‘Receivables’ which closed the period at $5.73 billion (2019: $8.09 billion).
Shareholders’ equity for the period was $16.27 billion relative to $16.43 billion last year. As such, resulting in a book value per share of $22.18 relative to $22.40 last year.
Analyst Certification -The views expressed in this research report accurately reflect the personal views of Mayberry Investments Limited Research Department about those issuer (s) or securities as at the date of this report. Each research analyst (s) also certify that no part of their compensation was, is, or will be, directly or indirectly, related to the specific recommendation (s) or view (s) expressed by that research analyst in this research report.
Company Disclosure -The information contained herein has been obtained from sources believed to be reliable, however its accuracy and completeness cannot be guaranteed. You are hereby notified that any disclosure, copying, distribution or taking any action in reliance on the contents of this information is strictly prohibited and may be unlawful. Mayberry may effect transactions or have positions in securities mentioned herein. In addition, employees of Mayberry may have positions and effect transactions in the securities mentioned herein.


