Date: May 16, 2018
Sagicor Group Jamaica Limited (SJ), for the three months ended March 31, 2018, reported total revenues increased by 5% to $15.82 billion from $15.08 billion in 2017, and was broken down as follows:
Net investment income declined to $4.10 billion from $4.54 billion in 2017. SJ noted that this was due to the “fall in interest rates.”
Fees and other revenue increased 18% to $2.38 billion (2017: $2.01 billion). “Fee-based income grew mainly from the expansion of our payments channels.”
Net premium revenue increased by 10% to a total of $9.34 billion from $8.53 billion in 2017.
Benefits and expenses totaled $12.54 billion for the period, increasing year over year by 2% from $12.31 billion. This increase was mainly driven by;
A 14% increase in net insurance benefits incurred to $6.19 billion (2017: $5.45 billion).
Administration expenses for the period amounted to $4.34 billion compared to $4.58 billion in the prior year, a 5% decrease.
Commission and related expenses fell by 2% to close at $1.26 billion down from the $1.28 billion posted in 2017.
Amortization of intangible assets amounted to $170.55 million (2017: $161.10 million), a 6% increase.
Asset tax moved up by 4% to close at $637.80 million in 2018 from $614.57 million in 2017.
Share of profit from joint venture amounted to $770,000 relative to $8.78 million the prior year. While share of profit from associates totaled $141.85 million relative to $158.13 million last year.
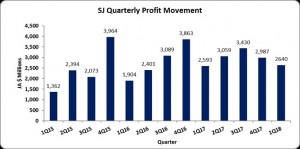
Profit before taxation amounted to $3.43 billion, a 17% gain when compared to the $2.92 billion booked in 2017.
After investment and corporation taxes of $786.46 million (2016: $326.51 million), net profit attributable to shareholders amounted to $2.64 billion (2017: $2.59 billion), an increase of 2%.
As a result, EPS for the quarter amounted to $0.68 (2017:$0.66) while the twelve-month trailing EPS totaled $ 3.10.
Balance Sheet at a glance:
Total assets increased by 5% or $16.53 billion to close at $355.25 billion as at March 31, 2018, from $338.72 billion the year prior. The main contributors to the increase in total assets were ‘Loans & leases, after allowance for credit losses’ amounting to $88.44 million (2017: $71.38 million), a 24% increase year over year and ‘Cash resources’ which closed at $22.71 billion compared $14.74 billion the previous year.
SJ noted, “Adoption of IFRS 9 during the quarter, led to Expected Credit Losses (ECL) of $530 million being recorded on debt securities classified as Amortized Cost and this reduced asset values.”
Equity attributable to stockholders of the company as at March 31, 2018, stood at $66.78 billion (2017: $59.40 billion) resulting in book value per share of $17.10 (2017: $15.21). The number of shares used in our calculations amounted to 3,905,634,918 units. SJ’s stock price closed on May 15, 2018, at $38.27.
Disclaimer:
Analyst Certification -The views expressed in this research report accurately reflect the personal views of Mayberry Investments Limited Research Department about those issuer (s) or securities as at the date of this report. Each research analyst (s) also certify that no part of their compensation was, is, or will be, directly or indirectly, related to the specific recommendation (s) or view (s) expressed by that research analyst in this research report.
Company Disclosure -The information contained herein has been obtained from sources believed to be reliable, however its accuracy and completeness cannot be guaranteed. You are hereby notified that any disclosure, copying, distribution or taking any action in reliance on the contents of this information is strictly prohibited and may be unlawful. Mayberry may effect transactions or have positions in securities mentioned herein. In addition, employees of Mayberry may have positions and effect transactions in the securities mentioned herein.