
March 01, 2018
SOS reported year end revenue of $906.51 million relative to 702.07 million in 2016, a 29% increase, while for the fourth quarter revenues amounted to $241.63 million (2016: $178.35 million).
The company’s cost of sales totaled $483.49 million up 33% relative to the $363.40 million reported in 2016. As a result gross profit grew by 25% amounting to $423.01 million relative to the $338.67 million booked in 2016. Gross profit for the quarter amounted to $104.50 million relative to $81.89 million in 2016.
Administrative expenses totaled $236.63 million up 25% compared to the $193.40 million booked in 2016, while selling and promotion expenses grew by 22% closing the period at $72.26 million relative to the $59.30 million reported in 2016.
The company’s depreciation cost amounted to $22.31 million an increase of 40% relative to the $15.94 million incurred in 2016, while finance cost decreased by 15% to close at $9.48 million (2016: $11.14 million).
Other operating expenses for the year amounted to $714,969 relative to $1.25 million in 2016. Gain on foreign exchange closed at $208,016 compared to a loss of $4.87 million in 2016.
Profit before taxes grew by 55% to $82.28 million relative to the $53.15 million earned in 2016.
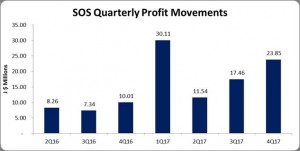
The company booked a tax credit of $684,870 compared to tax expense of $6.57 million. As such, net profit for the year totaled $82.97 million an increase of 78% relative to the $46.59 million reported in 2016. Net profit for the quarter amounted to $23.85 million (2016: $10.01 million).
Earnings per share for the year amounted to $0.33 (2016: $0.19), while EPS for the quarter totaled $0.10 relative $0.04 in 2016. The number of shares used in this calculation was 250,120,500. FOSRICH stock price closed the trading period on March 1, 2018 at a price of $5.08.
Balance Sheet at a glance:
Total Assets increased by 135% or $170.46 million to close at $655.20 million as at December 31, 2017 from $484.74 million the year prior. The growth year over year was due to a 31% increase in ‘Property, Plant & Equipment’ to $322.50 million (2016: $246.56 million).
Equity attributable to stockholders of the company as at December 31, 2017 stood at $413.76 million (2016: $242.64 million) resulting in book value per share of $1.65 (2016: $0.97). The number of shares used in our calculations amounted to 250,120,500 units.
Disclaimer:
Analyst Certification -The views expressed in this research report accurately reflect the personal views of Mayberry Investments Limited Research Department about those issuer (s) or securities as at the date of this report. Each research analyst (s) also certify that no part of their compensation was, is, or will be, directly or indirectly, related to the specific recommendation (s) or view (s) expressed by that research analyst in this research report.
Company Disclosure -The information contained herein has been obtained from sources believed to be reliable, however its accuracy and completeness cannot be guaranteed. You are hereby notified that any disclosure, copying, distribution or taking any action in reliance on the contents of this information is strictly prohibited and may be unlawful. Mayberry may effect transactions or have positions in securities mentioned herein. In addition, employees of Mayberry may have positions and effect transactions in the securities mentioned herein.


