
SOS reported six months revenue of $431.79 million relative to 353.48 million in 2016 a 22% increase, while for the second quarter revenues amounted to $211.603 million up 24% compared to the $171.05 million reported in the corresponding period of 2016.
The company’s cost of sales totaled $223.60 million up 24% relative to the $180.65 million reported in 2016. As a result gross profit grew by 20% amounting to $208.18 million relative to the $172.82 million booked in 2016, while gross profit for the quarter totaled $99.54 million (2016: $79.33 million).
Administrative expenses totaled $107.24 million up 18% compared to the $90.92 million booked in 2016, while selling and promotion expenses grew by 22% closing the period at $34.73 million relative to the $28.39 million reported in 2016.
The company’s depreciation cost amounted to $10.04 million an increase of 35% relative to the $7.44 million incurred in 2016, while finance cost rose by 6% to close at $4.87 million (2016: $4.58 million).
Profit before taxes grew by 17% amounting to $50.41 million relative to the $37.78 million earned in 2016.
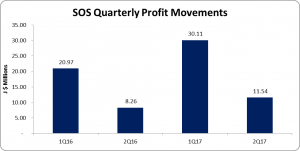
After income tax expense of $8.76 million (2016: 8.55 million), net profit for the period totaled $41.65 million an increase of 42% relative to the $29.23 million reported in 2016. Net profit for the quarter amounted to $11.54 million, up 40% from the $8.26 million earned in 2016.
Earnings per share for the quarter amounted to $0.05 (2016: $0.03), while EPS for the period totaled $0.17 relative $0.12 in 2016. The twelve month trailing EPS amounted to $0.24
Balance Sheet at a glance:
Total Assets increased by 62% or $210.95 million to close at $548.76 million as at June 30, 2017 from $337.81 million the year prior. The increase in total assets was primarily driven by an increase in property plant and equipment which totaled $268.76 million in 2017 (2016: $119.92 million).
Equity attributable to stockholders of the company as at June 30, 2017 stood at $284.29 million (2016: $118.95 million) resulting in book value per share of $1.14 (2016: $0.48). The number of shares used in our calculations amounted to 250,120,500 units.
Disclaimer:
Analyst Certification -The views expressed in this research report accurately reflect the personal views of Mayberry Investments Limited Research Department about those issuer (s) or securities as at the date of this report. Each research analyst (s) also certify that no part of their compensation was, is, or will be, directly or indirectly, related to the specific recommendation (s) or view (s) expressed by that research analyst in this research report.
Company Disclosure -The information contained herein has been obtained from sources believed to be reliable, however its accuracy and completeness cannot be guaranteed. You are hereby notified that any disclosure, copying, distribution or taking any action in reliance on the contents of this information is strictly prohibited and may be unlawful. Mayberry may effect transactions or have positions in securities mentioned herein. In addition, employees of Mayberry may have positions and effect transactions in the securities mentioned herein.


