
Date: May 13, 2019
Stationery and Office Supplies Limited (SOS) for the three months period reported revenues of $343.47 million relative to $279.18 million in 2018, a 23% increase.
The Company’s cost of sales totaled $175.04 million, up 24% relative to the $140.90 million reported in 2018. As a result, gross profit grew by 22% for the three months amounting to $168.43 million relative to $138.27 million booked in the previous corresponding period.
Administrative and general expenses totaled $77.19 million up $11.57 million from the $65.63 million documented in the prior comparable period. Selling and promotional expenses grew by 4% to close at $23.06 million (2018: $22.21 million).
Other income fell by 78% to close the period at $130,451 versus $598,158 reported in the same period last year.
The Company’s depreciation cost amounted to $8.45 million, an increase of 50% relative to the $5.64 million incurred in 2018, while finance cost closed at $2.96 million (2018: $2.27 million).
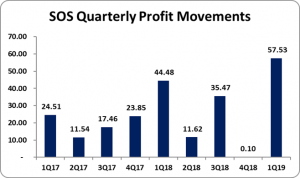
Profit before taxes grew by 29% amounting to $57.53 million versus $44.54 million earned in 2018. Following no income tax expenses (2018: $60,000), net profit for the period totaled $57.53 million, an increase of 29% relative to the $44.48 million reported in the prior corresponding period.
Earnings per share for the period amounted to $0.23 (2017: $0.18). The twelve-month trailing EPS amounted to $0.42. As May 13, 2019, the stock traded at $7.01.
SOS highlighted that, “during the quarter, SOS delivered the first export order to the islands for the year, a 20’ container of chairs with another export project looking to be delivered in the 2nd quarter of 2019.”
Furthermore, the Company mentioned that, “SOS was also very busy supplying and installing over 700 seats to the BPO sector as well. All of these factors led to positive financial performance with all key factors showing steady growth.”
Balance Sheet at a glance:
As at March 31, 2019, total assets increased by 30% to close at $878.34 million from $676.14 million twelve months earlier. The increase in total assets was primarily driven by an increase in ‘Intangible Assets’ and ‘Bank and Cash’ which closed at $14.15 million (2018: $4.95 million) and $54.92 million (2018: $19.20 million), respectively. ‘Trade and other receivables’ and ‘Prepayments’ also contributed to this increase to close at $181.62 million (2018: $110.54 million) and $19.20 million (2018: $12.56 million), respectively. In addition, ‘Property, Plant and Equipment’ closed at $383.07 million compared to $338.92 million as at March 31, 2018.
Equity attributable to stockholders of the Company as at March 31, 2019 stood at $539.62 million (2018: $458.21 million). This translated in a book value per share of $2.16 (2018: $1.83).
Disclaimer:
Analyst Certification -This research report is for information purposes only and should not be construed as a recommendation. Each research analyst (s) also certify that no part of their compensation was, is, or will be, directly or indirectly, related to the specific recommendation (s) or view (s) expressed by that research analyst in this research report.
Company Disclosure -The information contained herein has been obtained from sources believed to be reliable, however its accuracy and completeness cannot be guaranteed. You are hereby notified that any disclosure, copying, distribution or taking any action in reliance on the contents of this information is strictly prohibited and may be unlawful. Mayberry may effect transactions or have positions in securities mentioned herein. In addition, employees of Mayberry may have positions and effect transactions in the securities mentioned herein.


