
Date: August 15, 2018
Stationery & Supplies Limited (SOS), for the six months ended June 30, 2018, reported revenue of $519.21 million relative to $431.79 million in 2017 a 20% increase, while for the second quarter revenues amounted to $240.03 million up 13% compared to the $211.60 million reported in the corresponding period of 2017.
The company’s cost of sales totaled $259.62 million up 16% relative to the $223.60 million reported in 2017. Cost of sales, for the quarter, rose by 6% to $118.72 million (2017: $112.06 million). As a result, gross profit grew by 25% for the six months amounting to $259.59 million relative to the $208.18 million booked in 2017, while gross profit for the quarter totaled $121.31 million (2017: $99.54 million).
The company stated that, “During the quarter, SOS experienced significant changes in its operations with the launch of our SEEK Manufacturing Division. Seek began operations in the second week of May and for the month just under 21,000 books were produced. In June, that figure increased substantially to just over 96,000 books.”
SOS also mentioned that, “Start-up costs for SEEK including a one-time legal fee, security systems and other initial expenses along with the salaries for the new SEEK team, resulted in the SEEK division showing an operating loss, thereby reducing the overall gross profit.”
Administrative expenses totaled $142.37 million up 33% compared to the $107.24 million booked in 2017, while selling and promotion expenses grew by 28% closing the period at $44.45 million relative to the $34.73 million reported in 2017. For the quarter, Administrative expenses went up by 43% to $76.75 million (2017: $53.85 million), while selling and promotion expenses closed at $22.24 million (2017: $16.93 million), a 31% growth year over year. The company highlighted that, “The 43% increase was due to our staff compliment being increased from 95 employees at the end of June 2017 to 135 employees at the end of June 2018.”
The company’s depreciation cost amounted to $11.76 million an increase of 17% relative to the $10.04 million incurred in 2017, while finance cost closed at $4.70 million (2017: nil).
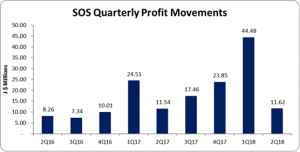
Profit before taxes grew by 11% amounting to $56.17 million relative to the $50.41 million earned in 2017. For the quarter, there was a 43% decline to $11.62 million (2017: $20.29 million).
After income tax expense of $60,000 (2017: $8.76 million), Net profit for the period totaled $56.11 million an increase of 35% relative to the $41.65 million reported in 2017. Net profit for the quarter amounted to $11.62 million, up slightly by 1% from the $11.54 million earned in 2017.
Earnings per share for the period amounted to $0.22 (2017: $0.17), while EPS for the quarter totaled $0.05 (2017: $0.05). The twelve-month trailing EPS amounted to $0.39. As at August 14, 2018, the stock traded at $9.35.
Balance Sheet at a glance:
Total Assets increased by 42% to close at $778.98 million as at June 30, 2018 from $548.76 million the year prior. The increase in total assets was primarily driven by an increase in non-current assets by 47% to $404.68 million (2017: $274.42 million). the growth stemmed from a 32% growth in Property, Plant & Equipment to $354.84 million (2017: $268.76 million). Bank and cash also contributed to the increase with a $60.60 million growth to $61.77 million relative to $1.16 million recorded twelve months earlier. Inventories rose 16% from $152.70 million in 2017 to $177.66 million in 2018.
Equity attributable to stockholders of the company as at June 30, 2018 stood at $459.86 million (2017: $284.29 million). This resulted in a book value per share of $1.84 (2017: $1.14).
Disclaimer:
Analyst Certification -The views expressed in this research report accurately reflect the personal views of Mayberry Investments Limited Research Department about those issuer (s) or securities as at the date of this report. Each research analyst (s) also certify that no part of their compensation was, is, or will be, directly or indirectly, related to the specific recommendation (s) or view (s) expressed by that research analyst in this research report.
Company Disclosure -The information contained herein has been obtained from sources believed to be reliable, however its accuracy and completeness cannot be guaranteed. You are hereby notified that any disclosure, copying, distribution or taking any action in reliance on the contents of this information is strictly prohibited and may be unlawful. Mayberry may effect transactions or have positions in securities mentioned herein. In addition, employees of Mayberry may have positions and effect transactions in the securities mentioned herein.


