
November 09, 2021
Stationery and Office Supplies Limited (SOS) for the nine months period reported revenues of $809.33 million relative to $711.68 million in 2020, a 14% increase. For the third quarter, revenues rose by 8% to close at $258.46 million (2020: $239.57 million). The company highlighted that, “SOS saw significant growth in all areas of the business when compared to the 3rd Quarter of 2020. One of the main factors contributing to this increase in profit is the fact that the company has made every effort to continue to reduce costs throughout the year.”
The Company’s cost of sales for the nine months totalled $389.65 million, up 6% relative to the $367.30 million reported in 2020. Cost of sales for the quarter grew by 5% to $128.90 million (2020: $122.95 million). Gross profit for the period rose by 22% amounting to $419.68 million relative to $344.38 million booked in 2020, while gross profit for the quarter improved to $129.56 million (2020: $116.62 million).
Administrative expenses totalled $244.90 million up 11% from $219.78 million booked in 2020, while selling and promotion expenses also grew by 11% closing the period at $60.84 million relative to the $54.90 million reported in 2020. For the quarter, Administrative expenses increased by 4% to $81.99 million (2020: $78.89 million), while selling and promotion expenses closed at $17.80 million (2020: $16.97 million), up 5% year over year.
The Company’s depreciation cost amounted to $24.68 million, a 6% decline relative to the $26.30 million incurred in 2020, while finance cost closed at $8.26 million (2020: $10.64 million). Finance income ended the nine-month period at $815,089 (2020: $149,146). SOS reported Loss on Foreign exchange of $3.81 million compared to $6.15 million booked for the corresponding period last year. No Profit on disposal of PPE was reported for the period, relative to the $3.34 million reported twelve months earlier.
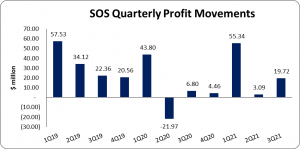
As such, Profit before taxes rose 173% amounting to $78.15 million relative to the $28.63 million earned in 2020. For the quarter, there was a 190% improvement to $19.72 million (2020: $6.80 million).
No tax expense was recorded, as such, net profit for the period totalled $78.15 million, a 173% uptick relative to the $28.63 million reported in 2020. Net profit for the quarter amounted to $19.72 million, relative to the $6.80 million earned in the previous corresponding quarter.
Total comprehensive income for the period ended at $78.15 million relative to the $28.63 million booked the prior year. Total comprehensive income for the quarter totalled $19.72 million compared to the $6.80 million in 2020.
Earnings per share for the period amounted to $0.31 (2020: $0.11), while EPS for the quarter totalled $0.08 (2020: $0.03). The twelve-month trailing EPS amounted to $0.33. As at November 09, 2021, the stock traded at $6.30 with a corresponding P/E ratio of 19.07 times.
Balance Sheet Highlights:
Total Assets increased by 2% to close at $918.76 million as at September 30, 2021 relative to $905.10 million reported twelve months earlier. The increase in total assets was primarily driven by increases in ‘Inventories’ which rose 21% to $280.49 million (2020: $232.68 million). ‘Trade and other receivables’ also contributed to the increase with an 20% increase to $116.08 million (2020: $96.64 million). The overall movement was tempered by a 43% decline in “Bank and Cash” to $63.42 million (2020: $111.85 million).
Equity attributable to stockholders of the Company as at September 30, 2021 stood at $687.88 million (2020: $625.28 million). This translated in a book value per share of $2.75 (2020: $2.50).
Disclaimer:
Analyst Certification -The views expressed in this research report accurately reflect the personal views of Mayberry Investments Limited Research Department about those issuer (s) or securities as at the date of this report. Each research analyst (s) also certify that no part of their compensation was, is, or will be, directly or indirectly, related to the specific recommendation(s) or view (s) expressed by that research analyst in this research report.
Company Disclosure -The information contained herein has been obtained from sources believed to be reliable, however its accuracy and completeness cannot be guaranteed. You are hereby notified that any disclosure, copying, distribution or taking any action in reliance on the contents of this information is strictly prohibited and may be unlawful. Mayberry may effect transactions or have positions in securities mentioned herein. In addition, employees of Mayberry may have positions and effect transactions in the securities mentioned herein.


