
March 3, 2022
Stationery & Office Supplies Ltd. (SOS), for the year ended December 31, 2021, reported year end revenue of $1.12 billion relative to $972.32 million in 2020, a 16% increase, while for the fourth quarter revenues moved from $260.64 million in 2020 to $315.52 million in 2021.
The company’s cost of sales totaled $573.70 million up 9% relative to the $526.89 million reported in 2020. As a result, gross profit climbed by 24% amounting to $551.15 million relative to the $445.43 million booked in 2020, while for the fourth quarter gross profit moved from $101.05 million in 2020 to $131.46 million in 2021.
Administrative expenses totaled $319.53 million up 11% compared to the $286.67 million booked in 2020, while selling and promotion expenses increased by 7% closing the period at $80.26 million relative to the $74.94 million reported the prior year.
The company’s depreciation cost amounted to $26.45 million a decrease of 7% relative to the $28.42 million incurred in 2020, while finance cost decrease by 25% to close at $11.14 million (2020: $14.91 million).
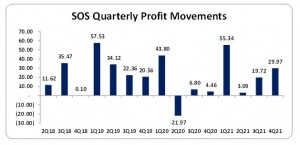
Profit before taxes increased by 199% amounting to $105.51 million relative to the $35.25 million earned in 2020. While, for the quarter, profit before tax closed at $27.36 million versus a profit before tax of $6.62 million reported in the prior comparable quarter.
After tax gain of $1.61 million (2020 charge: $2.16 million), net profit for the year totaled $107.12 million a 224% increase relative to the $33.09 million reported in 2020. Net Profit for the fourth quarter totalled $28.97 million (2020: $4.46 million).
Earnings per share for the year amounted to $0.43 (2020: $0.13), while EPS for the quarter totaled $0.12 (2020: $0.02). The number of shares used in our calculations amounted to 250,120,500 units. SOS’s stock last traded on March 1, 2022 at $7.48 with a corresponding P/E ratio of 17.47 times.
Balance Sheet Highlights:
Total Assets increased by 5% or $40 million to close at $928.02 million as at December 31, 2021 from $888.02 million the year prior. The movement was due to a 27% increase in ‘Inventories’ which closed at $296.02 million (2020: $232.65 million) as well as a 24% increase in ‘Trade Receivables’ amounting to $123.73 million (2020: $99.39 million). This was partially tempered by a 5% decline in ‘Property, Plant and Equipment’ which totalled $389.21 million (2020: $411.18 million).
Equity attributable to stockholders of the company as at December 31, 2021 stood at $676.83 million (2020: $609.73 million) resulting in book value per share of $2.71 (2020: $2.44).
Disclaimer:
Analyst Certification -The views expressed in this research report accurately reflect the personal views of Mayberry Investments Limited Research Department about those issuer (s) or securities as at the date of this report. Each research analyst (s) also certify that no part of their compensation was, is, or will be, directly or indirectly, related to the specific recommendation (s) or view (s) expressed by that research analyst in this research report.
Company Disclosure -The information contained herein has been obtained from sources believed to be reliable, however its accuracy and completeness cannot be guaranteed. You are hereby notified that any disclosure, copying, distribution or taking any action in reliance on the contents of this information is strictly prohibited and may be unlawful. Mayberry may affect transactions or have positions in securities mentioned herein. In addition, employees of Mayberry may have positions and effect transactions in the securities mentioned herein.


