
November 14, 2019
tTech Limited (tTech), for the nine months ended September 30, 2019, booked a 22% increase in revenues to $262.08 million compared to $214.84 million recorded for the prior financial year’s corresponding period. According to management, “Our revenue increase in this quarter was related to the continuation of major network upgrade projects where tTech, in addition to providing our traditional services, also procured and provided the equipment required to execute on these projects. Our important monthly recurring revenue from Managed IT Services continued to grow in Q3 with the addition of new customers using these services. Cost of sales increases were directly attributed to the sales of network equipment provided for the upgrade projects.” Revenue for the third quarter rose 51% to $105.17 million relative to $ 69.59 million for the same quarter of 2018.
Management also noted, “Monthly recurring revenues continue to trend in the right direction and our organization is working aggressively on the promise of delivering insanely good IT Services to our valued clients.”
Cost of sales increased by 41% to $74.87 million from $53.19 million reported for September 2018. As such, gross profit increased 16% for the period to $187.21 million (2018: $161.65 million). Gross profit for the quarter improved by a similar 16% to close the quarter at $64.93 million (2018: $56.11 million).
Other income contracted to $9.49 million for the nine months relative to $10.09 million in 2018, while administrative expenses rose 14% year over year to $141.76 million (2018: $124.45 million). Other operating expenses for the period reflected a 38% growth year over year to $28.06 million compared to $20.30 million recorded in 2018.
Operating profit for the period under review totaled $26.88 million, marginally less than the $26.99 million booked for the corresponding period of 2018. Year to date, tTECH booked finance income for 2019 of $1.10 million compared to $1.68 million recorded in the prior year’s corresponding quarter.
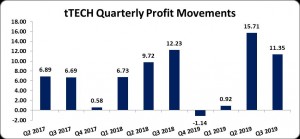
Consequently, no taxes were recorded for the period, thus net profit for the nine months amounted to $27.99 million versus $28.68 million booked for the same period of 2018. Management noted, “This decrease in profits is attributed to the increase in lower margin product sales this period versus the high margin services sales focused revenue in the comparative period last year.” Net profit for the quarter declined 7% to $11.35 million relative to $12.23 million reported for the third quarter of 2018.
The earnings per share (EPS) for the quarter amounted to $0.11 compared to $0.12 reported in 2018. EPS for the period totaled to $0.26 (2018: $0.27). The trailing twelve months EPS amounted to $0.25. The number of shares used in our calculations is 106,000,000 units. The company’s stock price closed the trading period on November 14, 2019 at $6.02.
TTECH stated, “tTech again received international recognition. After rigorous assessment we were awarded a place on the Channel Futures annual MSP 501 list that ranks the top 501 managed service providers in the world. Winners were celebrated at the MSP 501 Awards and Gala at an event in Washington, D.C. which tTech attended. We first made the list in 2017.”
Balance Sheet Highlights:
As at September 30, 2019, the Company reported total assets of $497.40 million, 2% above the $485.57 million reported as at September 30, 2018. This was as a result of a 50% increase in cash and cash equivalents to close at $69.57 million (2018: $46.23 million). Accounts receivables also contributed to the increase in total assets with a 47% growth to $67.42 million (2018: $45.97 million).
Shareholders’ Equity as at September 30, 2019 was $219.97 million compared to $207.06 million for the comparable period of 2018. This resulted in a book value per share of $2.08 compared to $1.95 the prior year.
Disclaimer: Analyst Certification -The views expressed in this research report accurately reflect the personal views of Mayberry Investments Limited Research Department about those issuer (s) or securities as at the date of this report. Each research analyst (s) also certify that no part of their compensation was, is, or will be, directly or indirectly, related to the specific recommendation (s) or view (s) expressed by that research analyst in this research report.
Company Disclosure -The information contained herein has been obtained from sources believed to be reliable, however its accuracy and completeness cannot be guaranteed. You are hereby notified that any disclosure, copying, distribution or taking any action in reliance on the contents of this information is strictly prohibited and may be unlawful. Mayberry may effect transactions or have positions in securities mentioned herein. In addition, employees of Mayberry may have positions and effect transactions in the securities mentioned herein.


