
November 10, 2022
U.S Consumer Price Index rises 7.7% YOY for the Month of October, lower than estimates
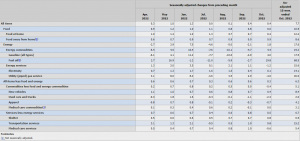
According to today’s report from the U.S. Bureau of Labor Statistics, the Consumer Price Index for All Urban Consumers (CPI-U) increased by 0.4 percent on a seasonally adjusted basis in October, matching the growth seen in September. Before seasonal adjustments, the all-items index rose 7.7% over the previous year.
With the indexes for gasoline and food also rising, the index for housing represented more than half of the monthly increase in all commodities. The energy index grew 1.8% during the course of the month as both the gasoline and electricity indices increased while the natural gas indices fell. With the food at home index growing by 0.4 percent, the food index grew by 0.6 percent over the course of the month.
Following a 0.6% increase in September, the index for all products except food and energy increased by 0.3% in October. Among those that rose over the course of the month were the indices for housing, auto insurance, recreation, new cars, and personal care. The used automobiles and trucks, health care, clothes, and airline prices indexes were among those that saw declines in October.
The growth in the all-items index for the twelve months ending in October was 7.7 percent, the weakest 12-month gain since the twelve months ending in January 2022. Over the past 12 months, the index for all items minus food and energy increased by 6.3%. In the 12 months ending in October, the energy index rose 17.6%, and the food index rose 10.9%; nevertheless, these gains were lower than for the 12-month period ending in September.
Food
After rising by 0.8 percent in September, the food index grew by 0.6 percent in October. October saw the weakest monthly gain in the food at home index since December 2021, a 0.4 percent increase. Over the course of the month, four of the six main grocery store food group indices showed growth. After climbing 0.5 percent in September, the index for other food consumed at home grew by 0.9 percent in October. During the month of October, the index for meats, poultry, fish, and eggs increased by 0.6 percent, while the index for cereals and bakery goods jumped by 0.8 percent. Following a 0.6 percent increase in September, the index for nonalcoholic beverages increased by 0.5 percent in October.
The index for fruits and vegetables, on the other hand, decreased 0.9 percent month over month after rising 1.6 percent in September. Fresh fruit index declined by 2.4 percent, while fresh vegetable index fell by 0.5 percent. In October, the index for dairy and associated products also fell, falling 0.1 percent.
Like in August and September, the food index measured away from the home increased in October by 0.9 percent. Over the course of the month, the indices for full service meals and limited service meals both rose by 1.1 and 0.8 percent, respectively.
Over the previous 12 months, the index for food at home increased by 12.4%. The index for dairy and allied items gained 15.5 percent during the course of the year, while the index for cereals and bread goods increased 15.9 percent. Meats, poultry, fish, and eggs had rises ranging from 8.0 percent to 15.4 percent for the remaining significant grocery store food groups (other food at home).
Over the previous year, the index for eating out increased by 8.6%. Over the previous 12 months, the index for full service meals increased by 9.0 percent, while the index for limited service meals increased by 7.1 percent.
Energy
Following three months of decline, the energy index rose 1.8 percent in October. Similarly, the gasoline index saw a monthly increase of 4.0 percent after three straight months of losses. (Prices of gasoline increased by 3.1 percent in October before seasonal adjustment.) The electricity index grew by 0.1 percent during the course of the month as well. The natural gas index, however, fell by 4.6 percent in October after rising by 2.9 percent in September.
The energy index increased 17.6% in the last 12 months. Over the same time, the fuel oil index jumped by 68.5 percent while the gasoline index increased by 17.5%. Over the previous 12 months, the index for electricity jumped by 14.1%, and the index for natural gas increased by 20.0%.
All items less food and energy
Following a 0.6-percent gain in September, the index for all items excluding food and energy increased by 0.3 percent in October. The shelter index increased again in October, reaching 0.8 percent, the biggest monthly increase since August 1990. The owners’ equivalent rent index increased by 0.6 percent, while the rent index increased by 0.7 percent for the entire month. After falling by 1% in September, the index for lodging away from home rose by 4.9% in October.
For all categories other than food and energy, the shelter index was the main contributor to the monthly increase in the index; for the other items, there was a mix of increases and falls. The motor vehicle insurance index was one of the indexes that increased in October, climbing 1.7 percent after increasing 1.6 percent in September. Following a little lesser increase of 0.1 percent the month before, the index for recreation increased by 0.7 percent for the entire month. In October, both the personal care and new vehicle indices grew by 0.5 percent.
The medical care index, in contrast, decreased 0.5 percent in October after increasing 0.8 percent in September. Both the index for prescription pharmaceuticals and the index for hospital and related services saw monthly declines of 0.1 and 0.2 percent, respectively. In October, the index for medical services remained constant.
The index for used vehicles and trucks, which fell 2.4 percent in October after falling 1.1 percent in September, is one of the other indexes that fell over the course of the month. After falling by 0.3 percent the month before, the apparel index dropped by 0.7 percent for the entire month. After rising by 0.8 percent in September, the index of airline fare decreased by 1.1 percent in October. Over the course of the month, the index for operations and home goods remained steady.
Over the previous 12 months, the index for all products minus food and energy increased by 6.3%. Over the past year, the shelter index grew 6.9 percent, making up more than 40% of the overall increase in all categories except food and energy. Other indexes that have seen significant growth in the recent year include medical care (+5.0%), home operations and furnishings (+8.4%), new cars (+8.4%), and personal care (+6.4%).
Not seasonally adjusted CPI measures
Over the previous 12 months, the Consumer Price Index for All Urban Consumers (CPI-U) grew 7.7%, reaching an index level of 298.012 (1982-84=100). Prior to seasonal adjustment, the index rose by 0.4% for the month.
Over the last 12 months, the Consumer Price Index for Urban Wage Earners and Clerical Workers (CPI-W) grew 7.9%, reaching an index level of 293.003 (1982-84=100). Prior to seasonal adjustment, the index rose by 0.4% for the month.
Over the previous 12 months, the Chained Consumer Price Index for All Urban Consumers (C-CPI-U) rose 7.5 percent. On a monthly basis, the index rose by 0.4% on a non-seasonally adjusted basis. Please be aware that the indexes for the previous 10 to 12 months may be updated.
Disclaimer:
Analyst Certification -The views expressed in this research report accurately reflect the personal views of Mayberry Investments Limited Research Department about those issuer (s) or securities as at the date of this report. Each research analyst (s) also certify that no part of their compensation was, is, or will be, directly or indirectly, related to the specific recommendation(s) or view (s) expressed by that research analyst in this research report.
Company Disclosure -The information contained herein has been obtained from sources believed to be reliable, however its accuracy and completeness cannot be guaranteed. You are hereby notified that any disclosure, copying, distribution or taking any action in reliance on the contents of this information is strictly prohibited and may be unlawful. Mayberry may affect transactions or have positions in securities mentioned herein. In addition, employees of Mayberry may have positions and effect transactions in the securities mentioned herein.


