
Date: February 18, 2019
Access Financial Services Limited (AFS) for the nine months ended December 31, 2018, reported total interest income of $1.24 billion, a 19% increase when compared with the $1.04 billion reported for the same time period in 2017. Of this, Interest Income from Loans amounted to $1.23 billion (2017: $1.03 billion) while Interest Income from Securities totalled $5.80 million, a decline from the $9.05 million reported in 2017. Total interest income reported for the quarter was $488.32 million, an 18% increase when compared to the $378.52 million reported in the same quarter for 2017.
Interest Expense charged for the nine month period totalled $83.13 million relative to $85.41 million in 2017. As such, AFS booked a Net Interest Income of $1.15 billion, a 21% increase relative to the $951.50 million reported for the same period in 2017.
Net Fees and Commission Income for the period under review amounted to $138.28 million, a 49% decline when compared to the $270.82 million reported for the comparative period in 2017. AFS reported $1.29 billion (2017: $1.22 billion) for Net Trading Income.
AFS reported an increase income from both Money Services and Other Income to total $1.30 million (2016: $1.12 million) and $7.41 (2017: $312,000) respectively. The company also reported Foreign Exchange gains of $29.47 million, a 16% decline when compared to $34.98 million in 2017. Consequently, total other operating income for the period amounted to $38.17 million, a 5% increase relative to the $36.40 reported for the same period in 2017.
AFS recorded total operating expenses of $676.42 million, an decline of 3% compared to $699.85 million in 2017. Of this, ‘Staff Costs’ increased 20% to $331.94 million (2017: $277.14 million) and ‘Allowance for Credit Losses’ amounted to $79.19 million, a decline of 57% compared to $185.83 million booked for the prior year’s corresponding period. ‘Depreciation & Amortization’ and ‘Other Operating Expenses’ booked for the period totalled $21.65 million (2017: $20.28 million) and $220.86 million (2017: $200.17 million) respectively.
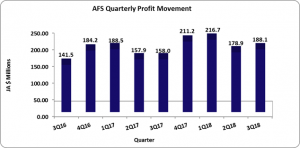
AFS reported a profit before taxation of $652.49 million relative to $558.88 million in 2017. AFS booked a profit for the period of $583.68 million (2017: $504.36 million), after tax charges of $68.81 million (2017: $54.52 million). Net profit for the quarter amounted to $188.07 million compared to $157.98 million booked for the comparable quarter of 2017.
Consequently earnings per share for the period amounted to $2.13 compared to $1.84 for the corresponding period in 2017. The EPS for the quarter amounted to $0.69 compared to $0.58 in the prior year. The trailing twelve months EPS is $2.90. The number of shares used in this calculation was 274,509,840 units. Notably, AFS stock closed the trading period on February 15, 2018 at a price of $48.10.
The Company noted, “On December 15, 2018 we concluded the acquisition of the Embassy Loans Inc, a Florida based Consumer finance Company. The results for the nine month period ended 31 December 2018 include the results of Embassy Loans for the 15-day period. The acquisition is currently being reviewed by our auditors, additional details of the transactions will be included in our next quarterly release.”
Balance Sheet Highlights:
As at December 31, 2018, the company’s assets totalled $4.99 billion, a 41% increase relative to the $3.54 billion in 2017. This growth in assets was as a results of the 38% and 720% increase in ‘Loans and Advances’ and ‘Intangible Assets’ respectively. ‘Loans and Advances’ amounted to $3.97 billion (2017:$2.87 billion), while ‘Intangible Assets’ totalled $349.99 million (2017: $42.54 million). Management noted, “the assets base of the company grew by $1.5 billion which represents a 41% increase over the comparative period as we record organic growth in disbursments and the recognition of the assets of Embassy Loans Inc.”
Shareholder’s equity as at December 31, 2018 stood at $2.47 billion (2017: $2.14 billion) resulting in book value per share of approximately $9.01 (2017: $7.79).
Disclaimer: Analyst Certification -The views expressed in this research report accurately reflect the personal views of Mayberry Investments Limited Research Department about those issuer (s) or securities as at the date of this report. Each research analyst (s) also certify that no part of their compensation was, is, or will be, directly or indirectly, related to the specific recommendation (s) or view (s) expressed by that research analyst in this research report.
Company Disclosure -The information contained herein has been obtained from sources believed to be reliable, however its accuracy and completeness cannot be guaranteed. You are hereby notified that any disclosure, copying, distribution or taking any action in reliance on the contents of this information is strictly prohibited and may be unlawful. Mayberry may effect transactions or have positions in securities mentioned herein. In addition, employees of Mayberry may have positions and effect transactions in the securities mentioned herein.


