
January 16, 2020
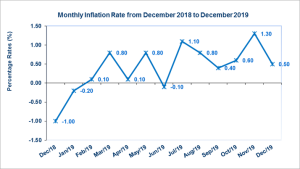
The consumer price index for the month of December 2019 increased by 0.5%, following a 1.3% increase in its index for November 2019, according to the Statistical Institute of Jamaica (STATIN). This movement was largely attributed to the upward movements in the division of ‘Food and Non-Alcoholic Beverages’ by 0.5% and ‘Housing, Water, Electricity, Gas and Other Fuels’ by 1.5%. “The increase for the heaviest weighted division ‘Food and Non-Alcoholic Beverages’ was mostly as a result of higher prices for vegetables as reflected in the 0.7% increase in the index for the class ‘Vegetables and Starchy Foods’ and the 0.5% increase in the index for ‘Meat’,” STATIN indicated. The ‘Transport’ division also contributed to December’s inflation rate with a 0.1% increase in its index, although there was a downturn in petrol prices, this was tempered by increases in the cost of air travel. Inflation within the Greater Kingston Metropolitan Area, Rural Areas and Other Urban Centres each increased by 0.6%, 0.4% and 0.5% respectively.
The index for the ‘Food and Non-Alcoholic Beverages’ division recorded a 0.5% increase in its index for December 2019. The ‘Food’ group recorded a 0.5% rise in its index due to the 0.7% increase in the class ‘Vegetables and Starch Foods’. According to STATIN, the movement was linked to, “higher prices for agricultural items, such as cabbage, carrot and tomatoes.” Other increases were recorded for the following classes: ‘Meat’ (0.5%), and ‘Sugar, Jam, Honey, Chocolate and Confectionery’(1.6%). From the ‘Non-Alcoholic Beverages’ group, the class ‘Mineral Water, Soft drinks, Fruits and Vegetable Juices’ registered a 0.2% growth in its index, as the classes ‘Coffee, Tea and Cocoa’ recorded an increase of 0.1%.
The index for the ‘Housing, Water, Electricity, Gas and Other Fuels’ division recorded a 1.5% increase in its index for December 2019, following a 1.2% increase for November 2019. The movement was as a result of the group ‘Electricity, Gas and Other Fuels’ registering a 2.4% increase in its index due to “higher electricity rates”. In addition, the increased rate for water and sewage also contributed to the upward movement, as the index for ‘Water Supply and Miscellaneous Services Related to the Dwelling’ moved upwards by 1.3%.
The index for the divisions ‘Furnishings, Household Equipment & Routine Household Maintenance’ increased by 0.1%. Moreover, increases were recorded across all the groups with ‘Goods and Services for Routine Household Maintenance’ increasing by 0.1% as a result of increased price for some household non-durables. ‘Furniture and Furnishings’ and ‘Household and Textiles’ went up by 0.3% and 0.2%, respectively.
The division ‘Health’ recorded an increase of 0.2% in its index for December 2019. This resulted from the ‘Medical Products, Appliances and Equipment’ and ‘Health Services’ group posting increases of 0.1% and 0.2%, respectively. The division ‘Clothing and Footwear’ increased 0.1% in its index as both groups ‘Footwear’ and ‘Clothing’ each registered a 0.1% growth for December 2019.
The divisions ‘Recreation and Culture’ and ‘Alcoholic Beverages’ recorded increases of 0.2% and 0.1% in their respective index for December 2019. The divisions ‘Miscellaneous Goods and Services’ produced an increase of 0.1% for December 2019. According to STATIN, this was as a result of, “the upward movements in the price for some personal care products.” Notably, the division ‘Restaurants and Accommodation Services’ registered a 0.1% rise for December 2019. STATIN stated that, “meals consumed away from home continued to be the main contributor to the increases in this division.” Lastly, the division ‘Communication’ and ‘Education’ had no effect on the index for December 2019.
The movement in the index for the calendar-year-to-date inflation rate was 6.2%, fiscal year-to-date was 5.5% and the point-to-point movement was 6.2%. Individual divisions saw the following changes:
- Food and Non-Alcoholic Beverages: (0.5%)
- Alcoholic Beverages and Tobacco: (0.1%)
- Clothing and Footwear: (0.1%)
- Housing, Water, Electricity, gas and Other Fuels: (1.5%)
- Furnishing, Household Equipment and Routine Household Maintenance: (0.1%)
- Health: (0.2%)
- Transport: (0.1%)
- Communication: (0.0%)
- Recreation and Culture: (0.2%)
- Education: (0.0%)
- Restaurants and Accommodation Services: (0.1%)
- Miscellaneous Goods and services: (0.1%)
Analyst Certification -The views expressed in this research report accurately reflect the personal views of Mayberry Investments Limited Research Department about those issuer(s) or securities as at the date of this report. Each research analyst (s) also certify that no part of their compensation was, is, or will be, directly or indirectly, related to the specific recommendation(s) or view(s) expressed by that research analyst in this research report.
Company Disclosure -The information contained herein has been obtained from sources believed to be reliable, however its accuracy and completeness cannot be guaranteed. You are hereby notified that any disclosure, copying, distribution or taking any action in reliance on the contents of this information is strictly prohibited and may be unlawful. Mayberry may effect transactions or have positions in securities mentioned herein. In addition, employees of Mayberry may have positions and effect transactions in the securities mentioned herein.


